Anatomy of a geospatial powerline project
Ever wondered what the are the key stages in our powerline analysis projects? Here we explore the 5 key steps for modelling powerlines and some of the useful insight this provides our clients.
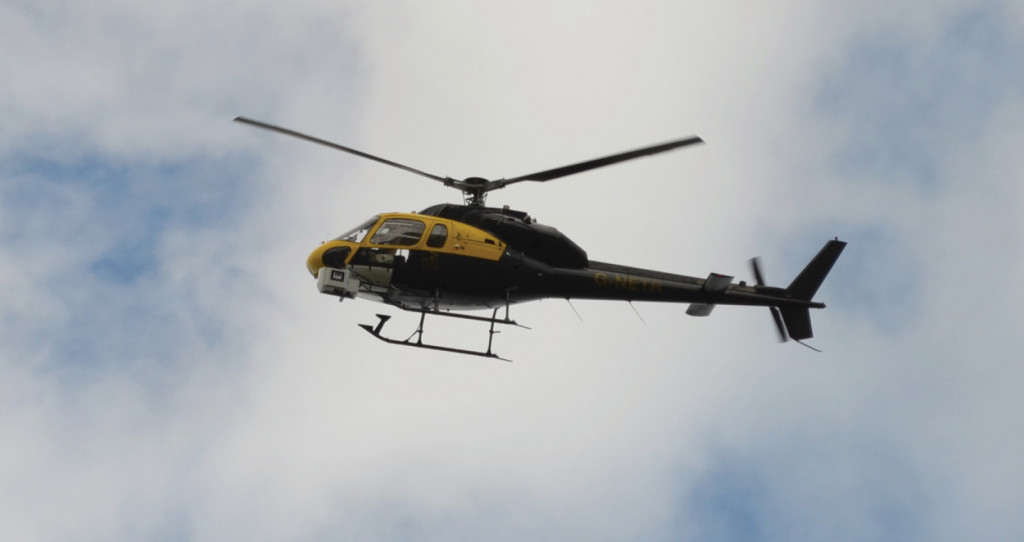
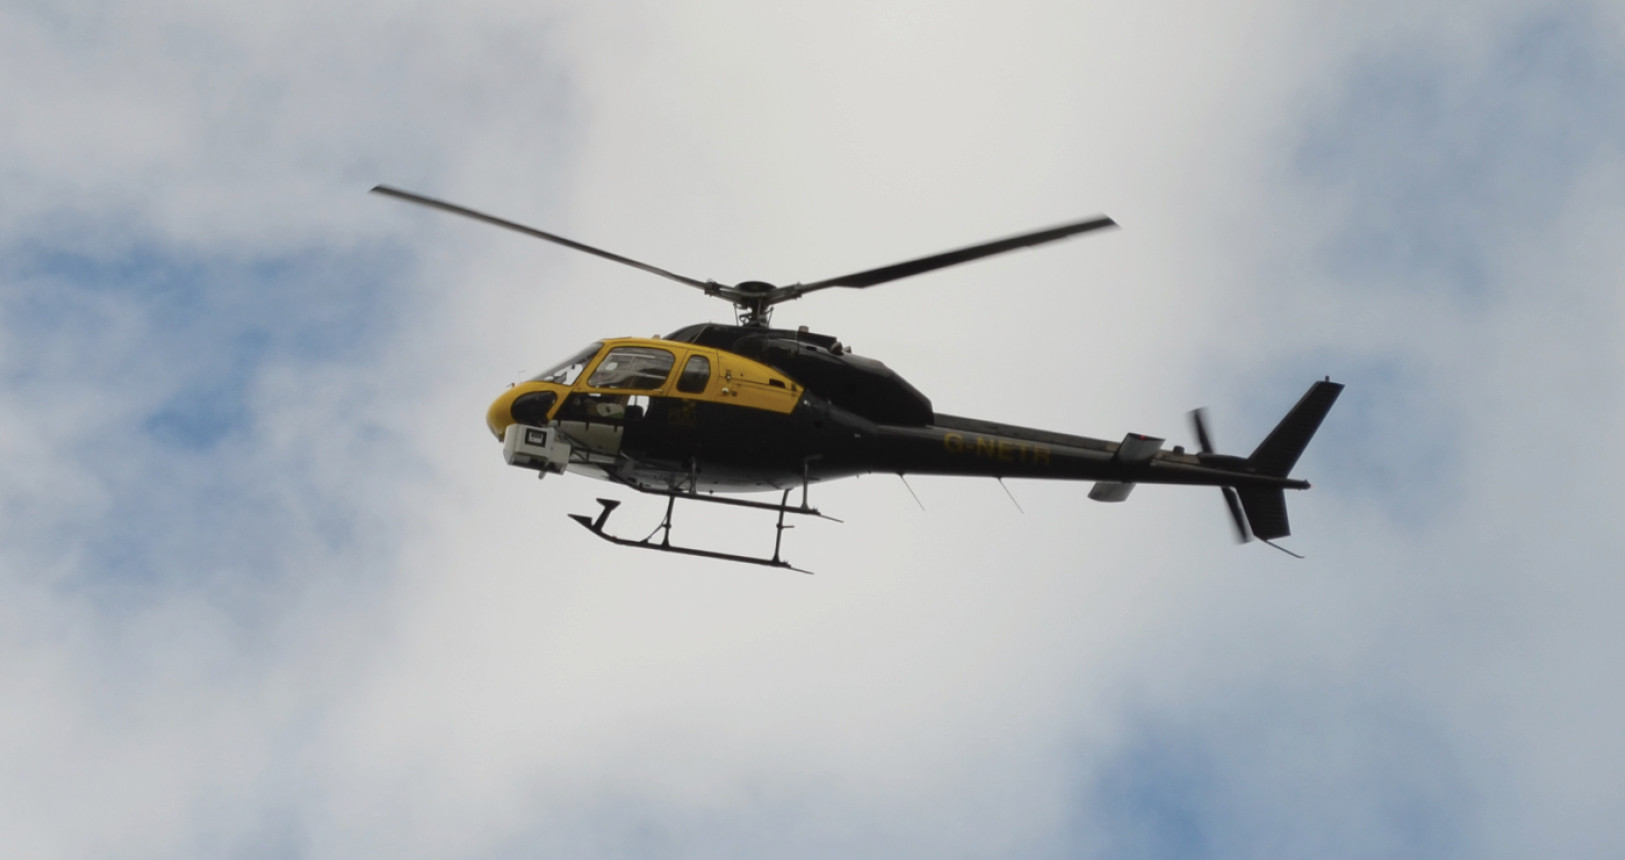
1. LiDAR and image data for a power network are captured in the field. Usually this is using a helicopter or fixed wing aircraft to acquire the data.
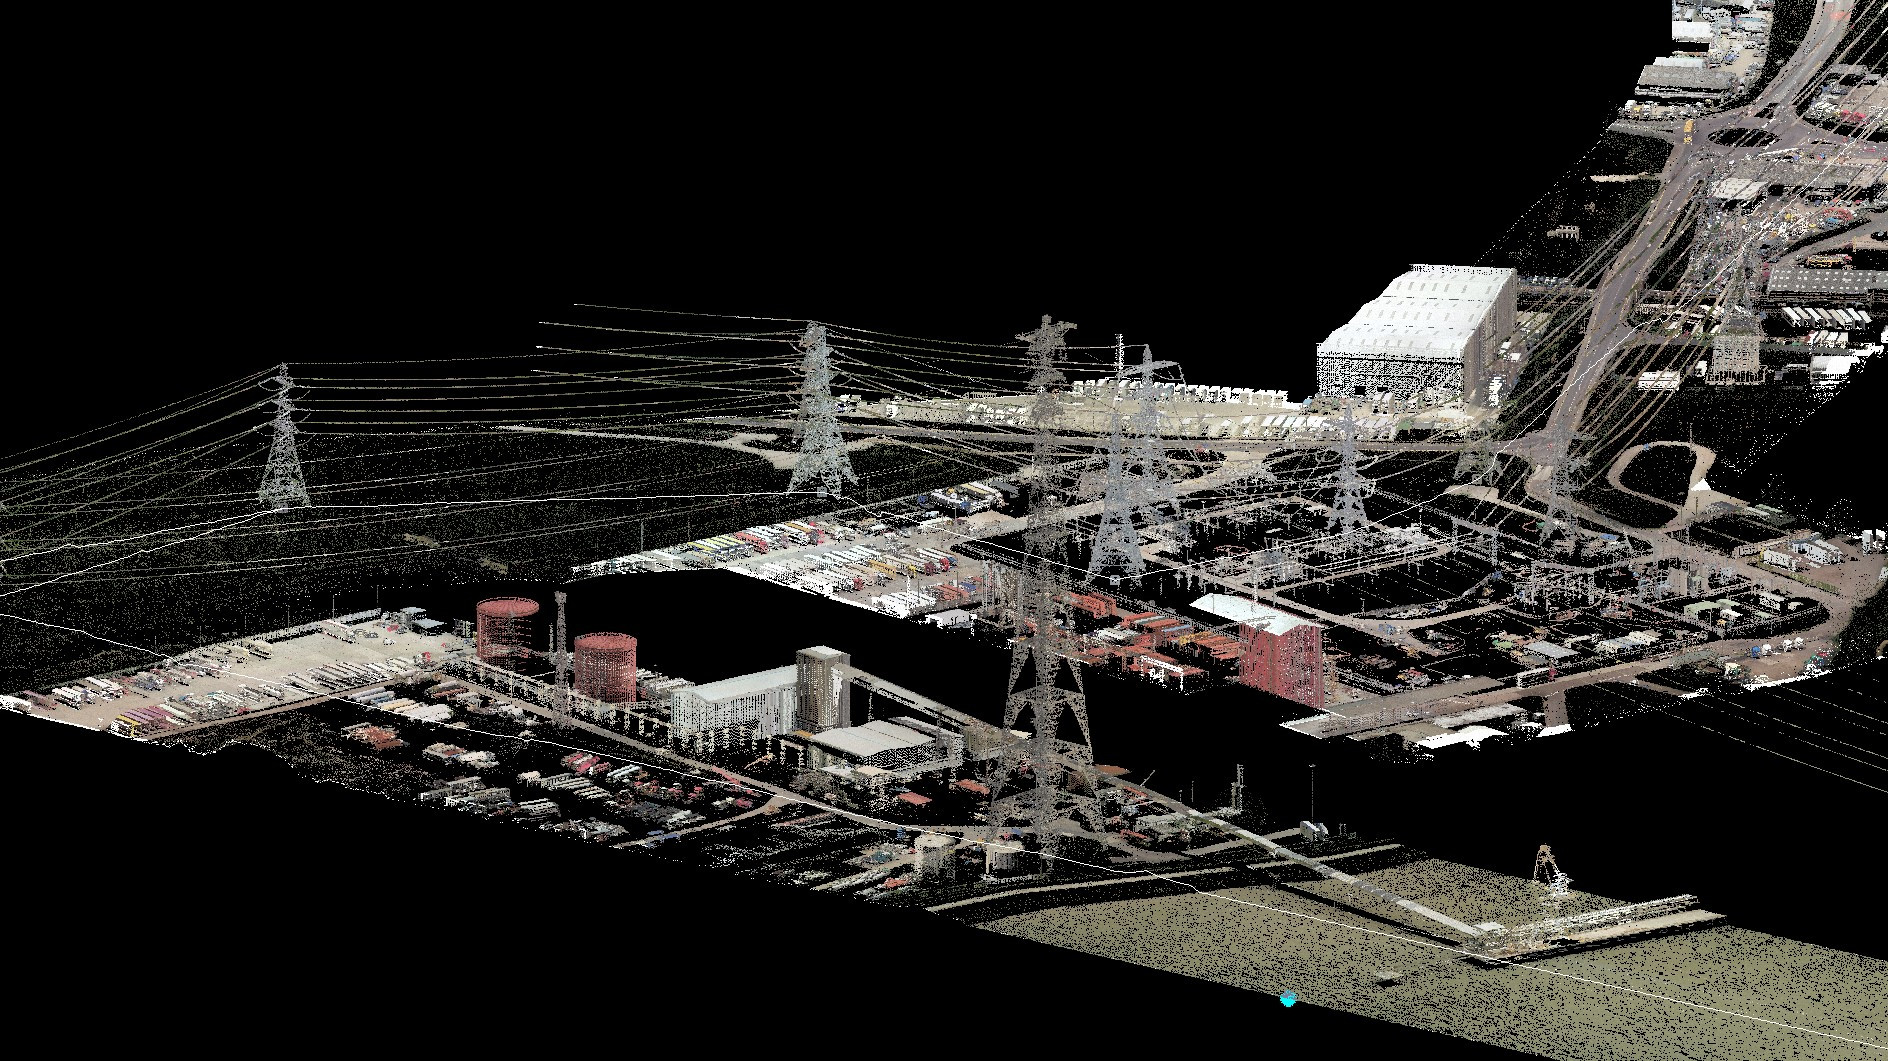
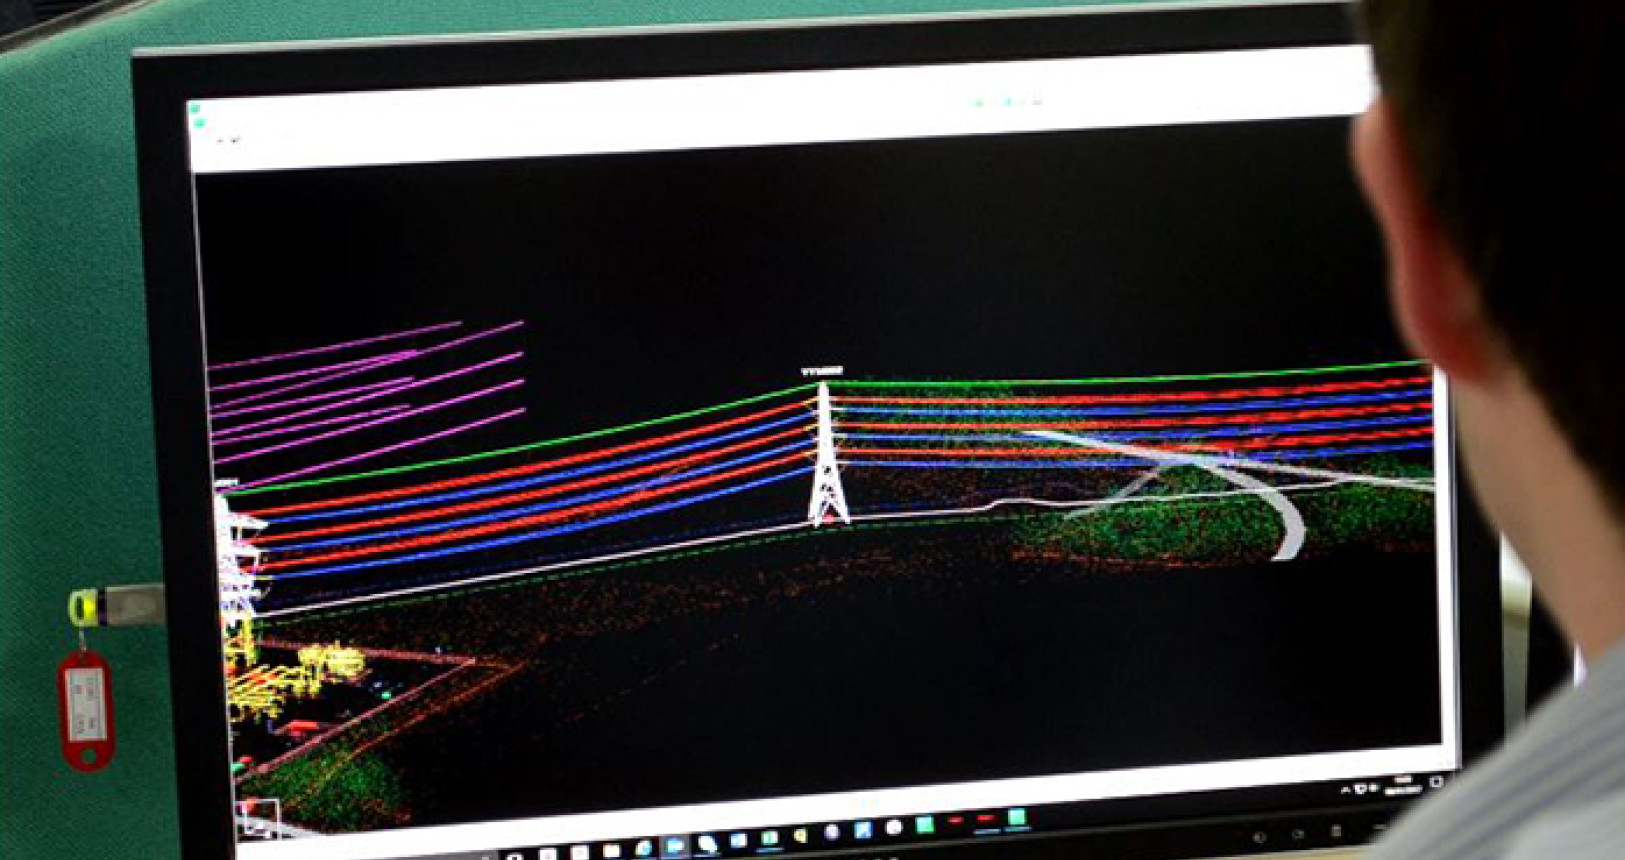
2. LiDAR and images are ‘built’, aligning the data strips from each flight into a single useful project. This provides the base for the subsequent processing stages.
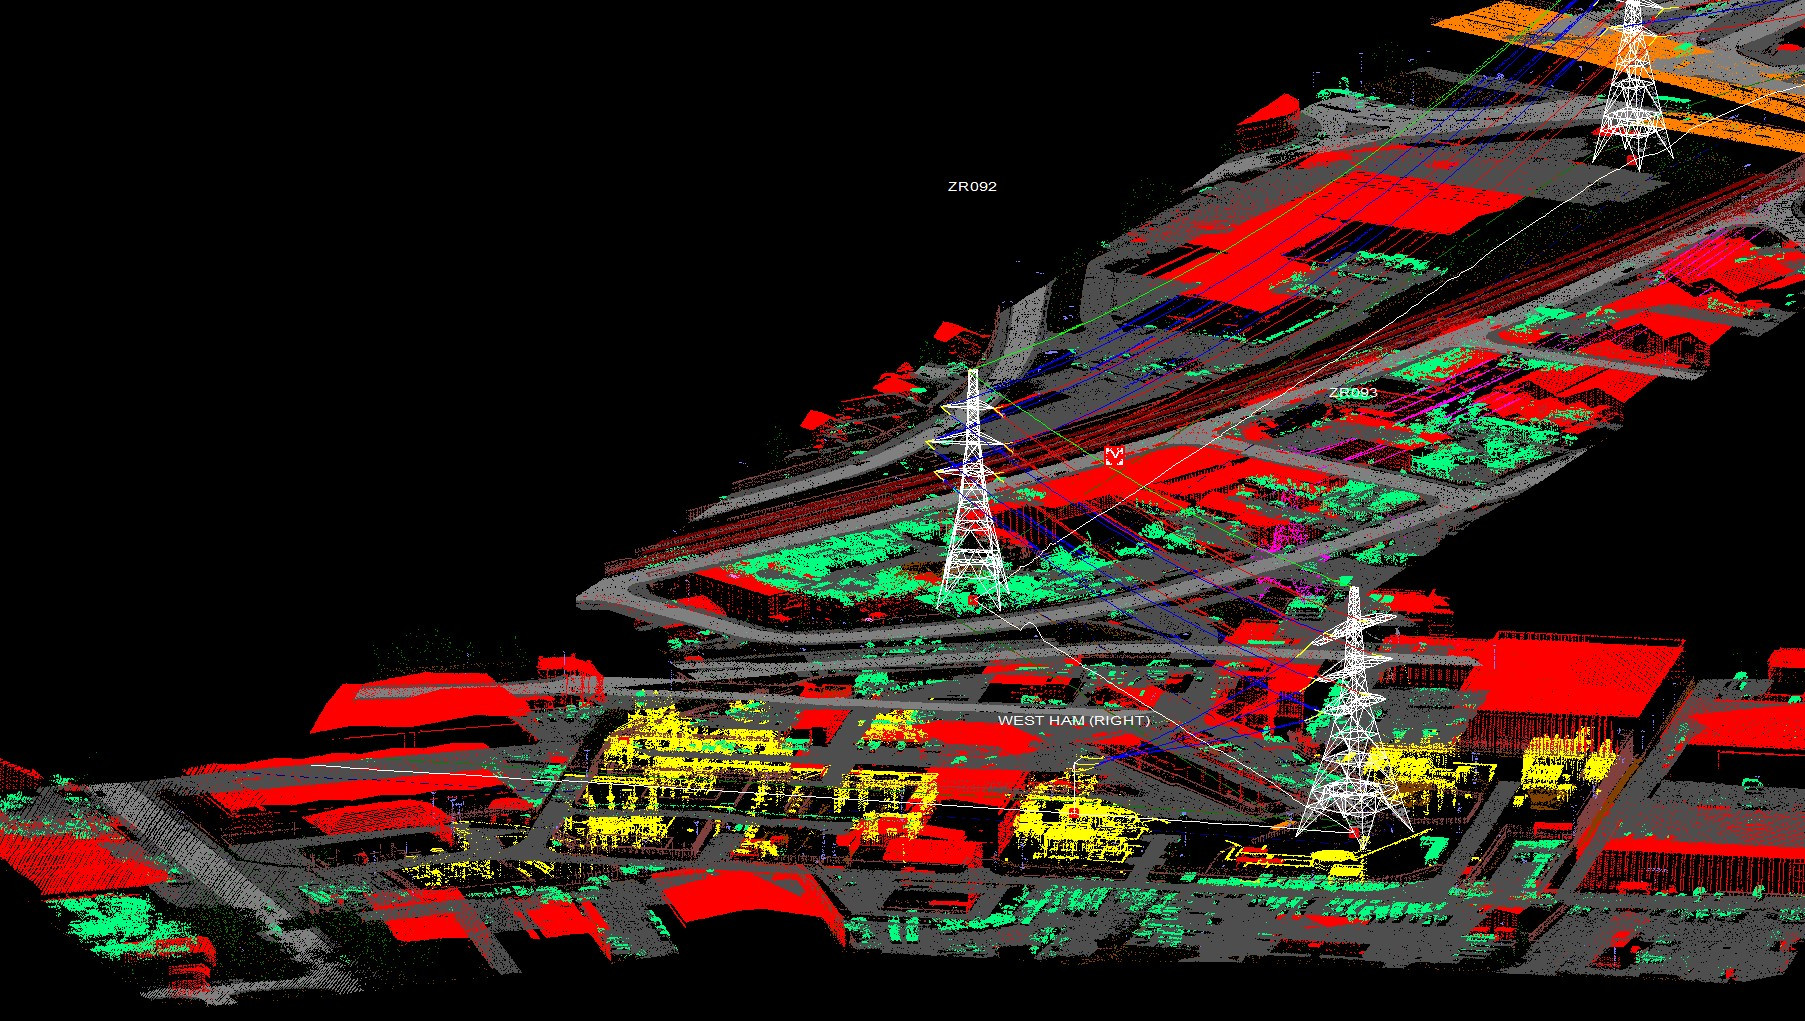
3. The LiDAR data is classified and features are extracted. In order to be able to conduct any meaningful analysis we need to know what the survey data consists of. Providing each ‘LiDAR point’ with a feature is a critical step.
4. We model the position of the conductors within a CAD environment, modelling sag and sway at the lines maximum operating temperature. This accounts for the worst case loading scenario in any further analysis.
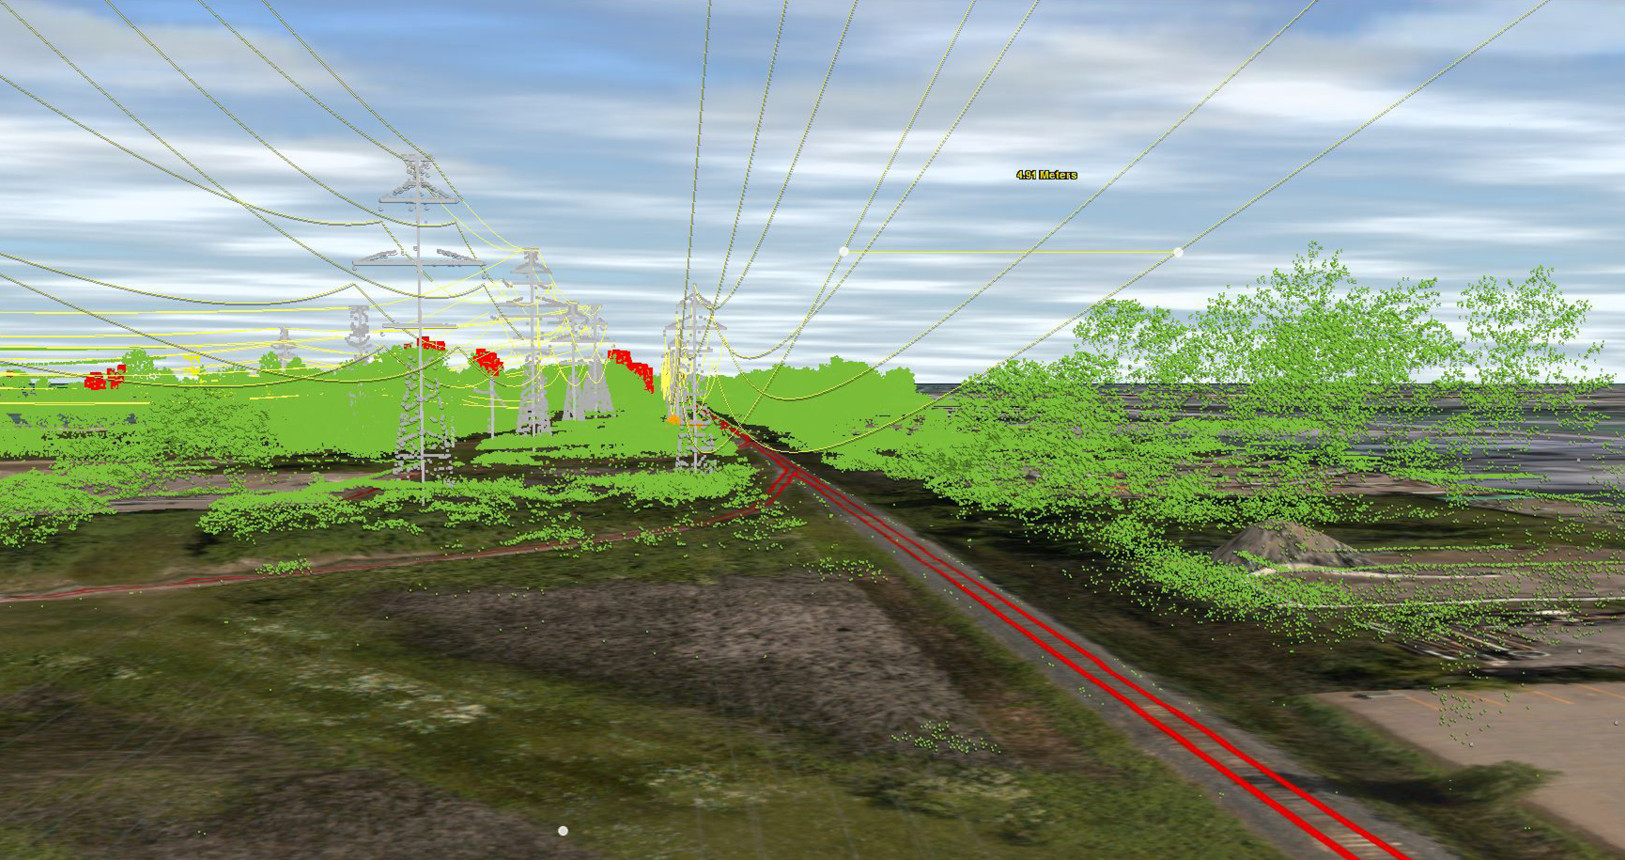
5. Now the fun bit – turning analysis into insights for our clients! This might be confirming the powerline rating, looking at methods to increase line utilisation or determining where vegetation is infringing minimum clearances.
6. It doesn’t stop there. Want to understand how fast trees are growing on your network, visualise every structure in 3D or work with the latest technologies like Augmented Reality? Contact us to discuss the possibilities today.