Using Remote Sensing to predict tree growth on power networks
One of the most valuable outputs from our Vegetation Analytics is using of remote sensing data to better understand vegetation growth rates on the network. This sophisticated analysis lets vegetation managers design better programs – leading to reduced expenditure, a more defendable schedule of work and increased network reliability.
Why use remote sensing data when growth charts exist?
There are databases on the behaviour of different tree species when assessing tree growth. However, in the context of Utility Vegetation Management (UVM) we have found these to be less valuable. Growth models in academic and forestry applications tend to be for merchantable timber yields rather than power networks. They are often based in a mono-culture environment, such as managed woodland, making them much less relevant for the natural environment surrounding powerlines. Further, growth models typically assess the upwards growth (for timber yield) and not outwards growth or the change in growth speed following cut backs (and the method of cut back).
Additionally, our research has shown that to be effective you need to look at a specific, local environment. Even different portions of the same network with the same species mix can exhibit different trends. So a general model doesn’t provide the granularity needed.
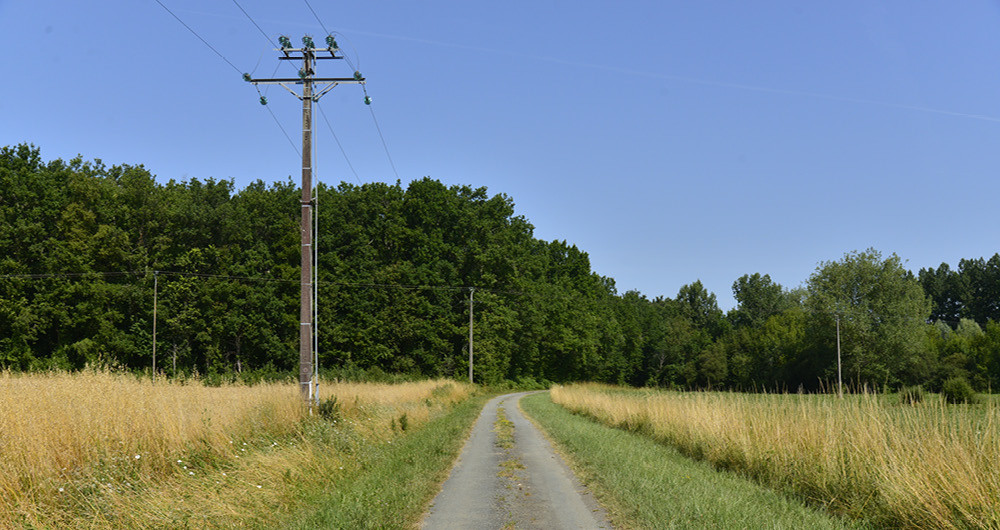
Managing vegetation on a network more effectively requires the use of targeted data analysis
How do you use historic data to make predictions?
Tree growth really isn’t a simple prediction. It changes depending on factors such as species, age of tree, competition and climate. This means applying a broad brush estimate can be unhelpful – leading to over estimation (excess work is done) or underestimation (network is exposed). By using LiDAR to measure the observed growth of vegetation towards the conductor however, we can begin to create real world and highly localised growth rate predictions. Trees are measured in the very conditions they are likely to continue to grow in rather than in a generalised fashion. In parallel, we use our knowledge of historical weather on the network (such as rainfall) to ensure predictions correlate to current and expected conditions.
Using UVM records from a network we can track the effect on growth speed from different management activities (to ensure they are providing best value). It is also possible to track the natural in-growth towards the wires. Helping a utility plan required cut back based on average climate or prepare for wetter or warmer years.
So why would you want to assess growth on the network?
The advantages from better understanding tree growth are many. Being able to use expected growth for a span provides an indicator of how many years a tree will take to violate minimum clearances. Building this up for each span, you have the means to determine a compliance estimate for the network. From there you can inform an annualised cutting program to cut only when needed to ensure compliance. Optimising work to cut other nearby trees where it is advantageous to do so (i.e. soon to be non-compliant).
For utilities looking to move away from a patrol and cut approach or a generalised cyclical approach with broad-brush assumptions, this data arms with them with the information needed for span based contracts.
As part of a suite of analyses to optimise UVM, vegetation growth rates can provide powerful insight on a network. Letting an operator target their cutting work effectively without increasing their risk profile.
Learn more about our Vegetation Management service.