Vegetation Analytics
Harnessing forestry research and an innovative data science toolkit, we are enabling network operators to benefit from predictive analytics for vegetation management. Vegetation Analytics lets our customers move beyond the ‘expiring’ snapshot of the network derived from LiDAR and address much broader challenges in compliance, risk reduction and work efficiency. This approach will save money, reduce risk - or even do a balance of both.
What is Vegetation Analytics?
It is a big data approach to modeling the status and trends of vegetation adjacent to powerlines. We utilize historical information and a suite of analysis tools to look at every tree and calculate its growth, its ability to hit the line and its likelihood of falling. Paired with risk criteria and cost information specific to the network operator, this allows for significantly improved targeting of tree inspections and the design of management programs for trimming/felling which optimize cost, risk or a balance of both.
In practice, we combine existing geospatial datasets, management records of past cutting, environmental and weather data, soil and topographic information, species categorisations, vegetation changes (extent, density) and a range of other sources, to make informed predictions for optimizing UVM decisions.
For the network owner/operator, this enables data-driven decision making - where to trim, to what extent, on what cycle? Which trees should be inspected for potential felling or further monitoring? Which parts of the network are most at risk, based on localized vegetation trends, the propensity for fires/storms and the number of customers connected? Being predictive, we want to enable questions such as these at any point in the future - new data simply updates the prediction.
Key benefits of vegetation analytics
- Make use of existing geospatial data from any LiDAR provider
- Ensure ongoing compliance by prioritizing work to where compliance is most likely to be breached
- Identify an optimal strategy of pruning vs tree removal
- Quantify scope of work for contractors, increasing cost certainty and better value contracts
- Risk-rank trees based on likelihood to fall versus local fall patterns (analysis has shown >80% success rate in modeling)
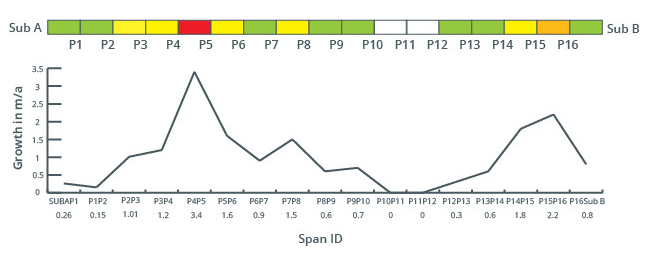
- Model vegetation growth rates per span to optimize (and often lengthen) cutting cycles. Thereby reducing the cost of patrols and cutting with no increased risk exposure.
- Our service is based on objective, published scientific research (conducted in collaboration with a top university)
- Machine learning techniques and cloud computing enable massive datasets to be rapidly modeled
Vegetation Analytics. Understand network trends
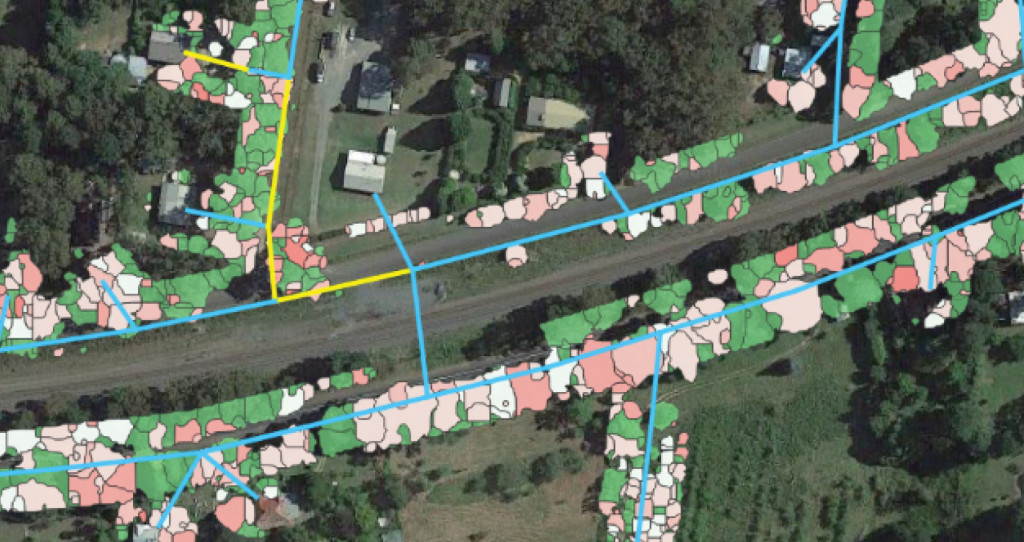
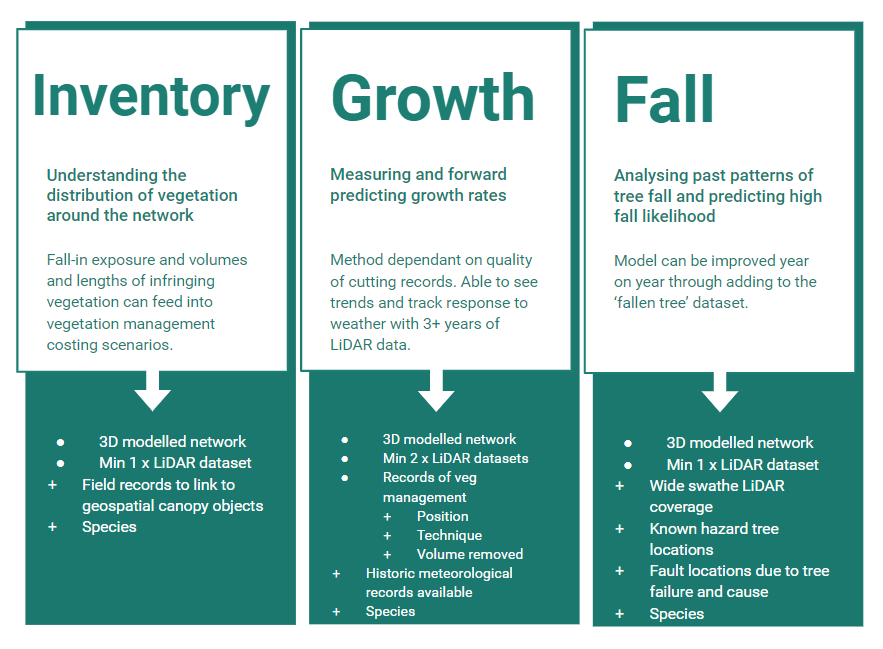
Inventory - enables the identification of exactly which spans have trees, how many and how close they are to the line. It also helps define the best course of management, i.e. if there are many high-risk trees then removal is likely to be more cost effective than pruning and vice versa. This enables more cost effective maintenance cycles.
Growth rates - providing utility specific measurements of vegetation growth rates to optimize (and often lengthen) cutting cycles as necessary. Thereby reducing the cost of patrols and cutting with no increased risk exposure.
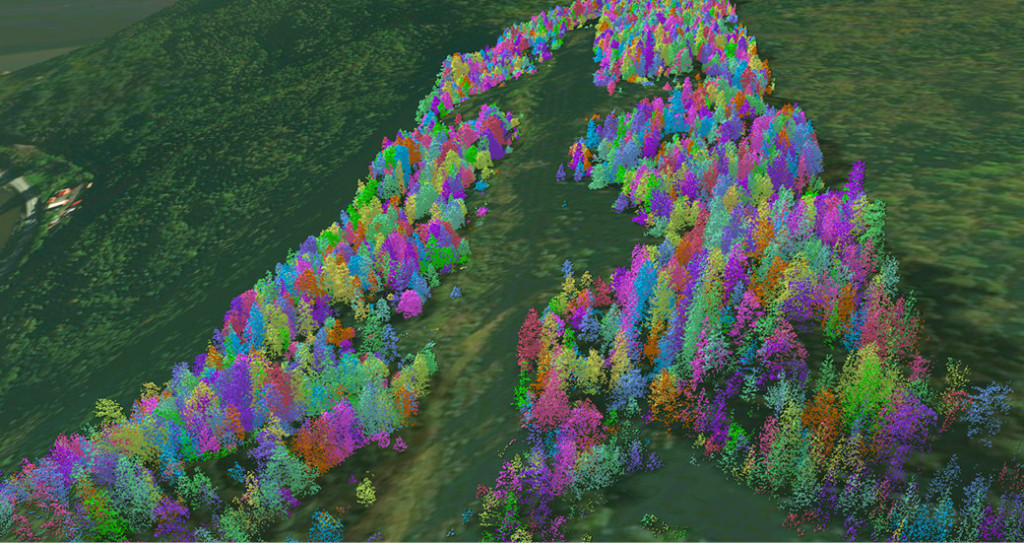
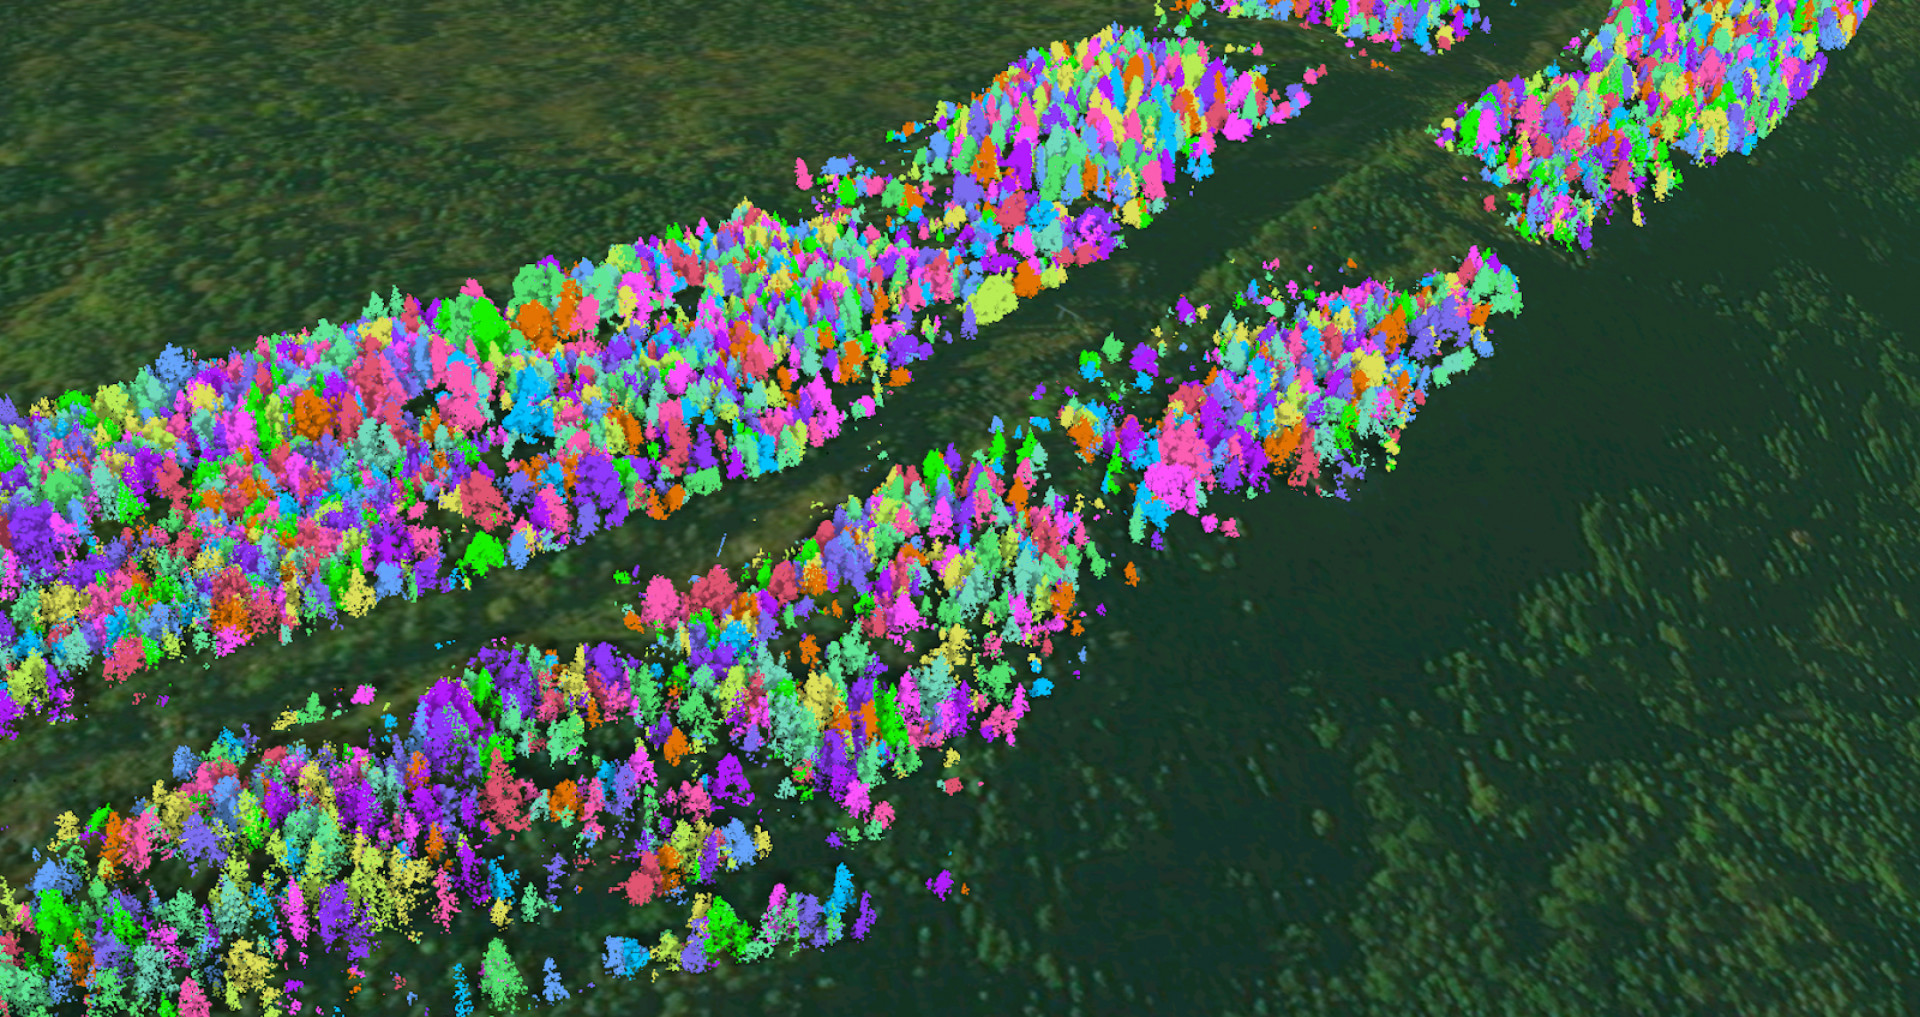
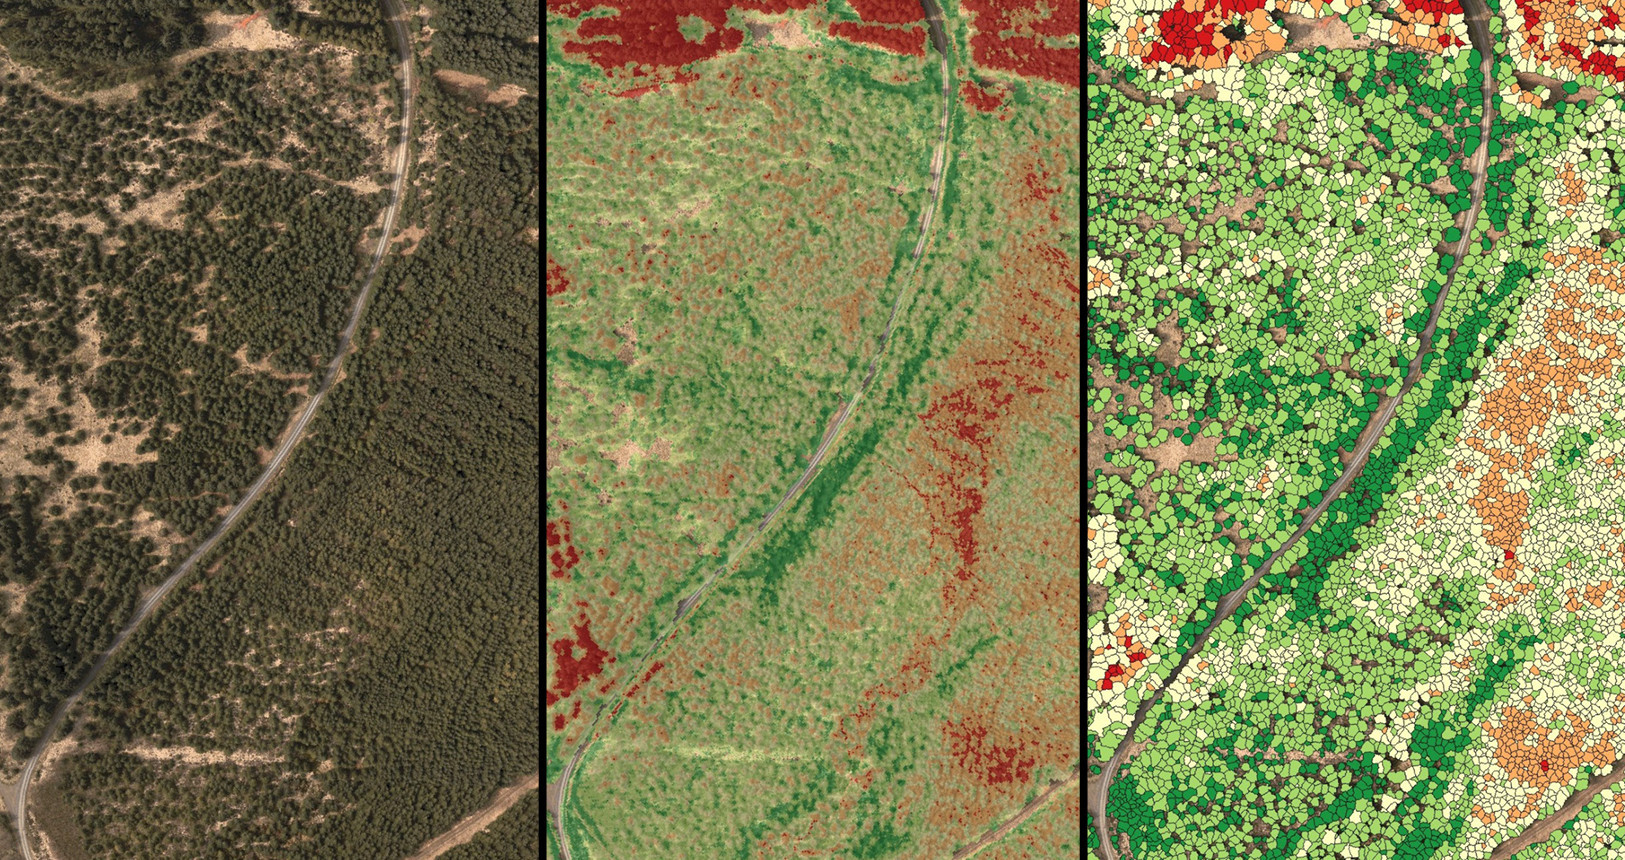
Tree fall risk -by identifying trees that are most at risk of falling into the line and causing an outage. Tree fall analysis using LiDAR has traditionally highlighted any tree that is ‘geometrically close enough to fall’ as a risk. Our approach extracts much more value from the LiDAR dataset to model local topographic, meteorological and vegetation structural factors that contribute to tree failure and extrapolates this to any potential threat. This allows for identification of trees more at risk of failure, modeling the local and environmental patterns and historic tree fall events.
Vegetation Analytics FAQ's
Why did you create Vegetation Analytics?
The current Business as Usual (BAU) approach for Vegetation Management using geospatial data is to conduct compliance reporting. This uses the specific locations of vegetation and wires at the time the data is captured. Our new approach extends existing science in forestry and vegetation hazard management to use predictive modeling, machine learning and new technologies, objectively reducing spend while increasing resilience.
NM Group, in collaboration with an academic Knowledge Transfer Partnership (KTP) with Durham University, created a new technology approach to avoiding outages through better identification and prioritization of vegetation risk to power networks. We call this Vegetation Analytics.
What is wrong with the current Business as Usual approach?
The limitations of the current BAU approach is that although high quality, accurate geospatial data is incredibly valuable, there is often a gap between the data and the ability to use this data effectively. This is due to a number of reasons.
If the data is just using a snapshot in time and decisions are made purely on the proximity of trees to wires, there is a plethora of more advanced analysis that are being ignored. Take the example of tree fall risk. A potential hazard tree is any tree that if it fell would touch the line. However, for a distribution utility that may have large exposure to vegetation due to its network size this might number hundreds of thousands of trees. In addition, they are often on private or subject to environmental restrictions land and so cannot be cut back or removed without good cause. This calls for a more objective measure of risk identification in order to inform where resources are best deployed.
Another way BAU approaches fall short is they typically ignore previous datasets, geospatial or otherwise. Historical information can tell you a lot about what happened and why, in order to make new, accurate predictions. By looking at the data more holistically, operators can exploit some key advantages.
What kinds of data do you need for Vegetation Analytics?
The data you need depends on the outcomes you would like to achieve. The better quality the data the better quality the analysis. Though we usually work with LiDAR data, if you have extensive field records as a contractor this can sometimes yield the potential for similar analyzes.
How much data do you need for Vegetation Analytics?
Again it depends on what you want to achieve but in general, the more data the better. One LiDAR dataset gives a snapshot, with two you can start to track changes and three or more means you can begin to forward predict with increasing accuracy.
How long does it take to conduct the analysis?
Every client is different and, as we believe the best results are achieved through a collaborative approach, the time taken to perform vegetation analytics can be dependant on client availability in the early stages. However, once objectives are confirmed we generally aim to undertake the analysis within 3-6 months. This can be dependant on developing new analysis techniques after client request, the size of the network and the volume and quality of datasets. Though the analysis we do allows the results to have more longevity than a normal LiDAR survey and the time sensitivity to have results by a certain milestone date isn’t often the case, without the risks and difficulties of the capture process and with cloud processing capabilities we are able to confidently provide accurate timescales to provide results quickly.