A Closer look at... Powerline modeling using LiDAR

One of our project managers gives behind-the-scenes insight into how NM Group processes the geospatial data captured during surveys and what value this gives our clients.
“We have multi-disciplinary teams working tangentially on different phases of processing. This allows a knowledge transfer between team members and makes things more flexible, facilitating intelligent resourcing and time management.
We receive the LiDAR data and high resolution imagery captured in the field and it is assessed to ensure its suitability and viability for processing by the team. Then we take the data through three separate stages. The first is the build stage, where the data is tied together, making it spatially accurate and ensuring the imagery matches the LiDAR. Basic classification is done, whereby LiDAR points are assigned as ground or vegetation. Then it is passed onto powerline GIS specialists to associate classification to the features; identifying wires, towers, buildings, vegetation etc. according to the client’s specification. At that point the data is ready to import into PLS-CADD™.
This import, the classified point cloud overlaid with orthorectified imagery, is our most basic engineering product. We can enhance the basic import through putting in dummy structures or adding oblique structure imagery. We can put in the points of attachment to the insulator, which will further support the client’s onward processing. The PLS-CADD™ import speeds up processing for clients, providing them a meaningful starting point for their engineering models. It’s a long way from just raw LiDAR data!
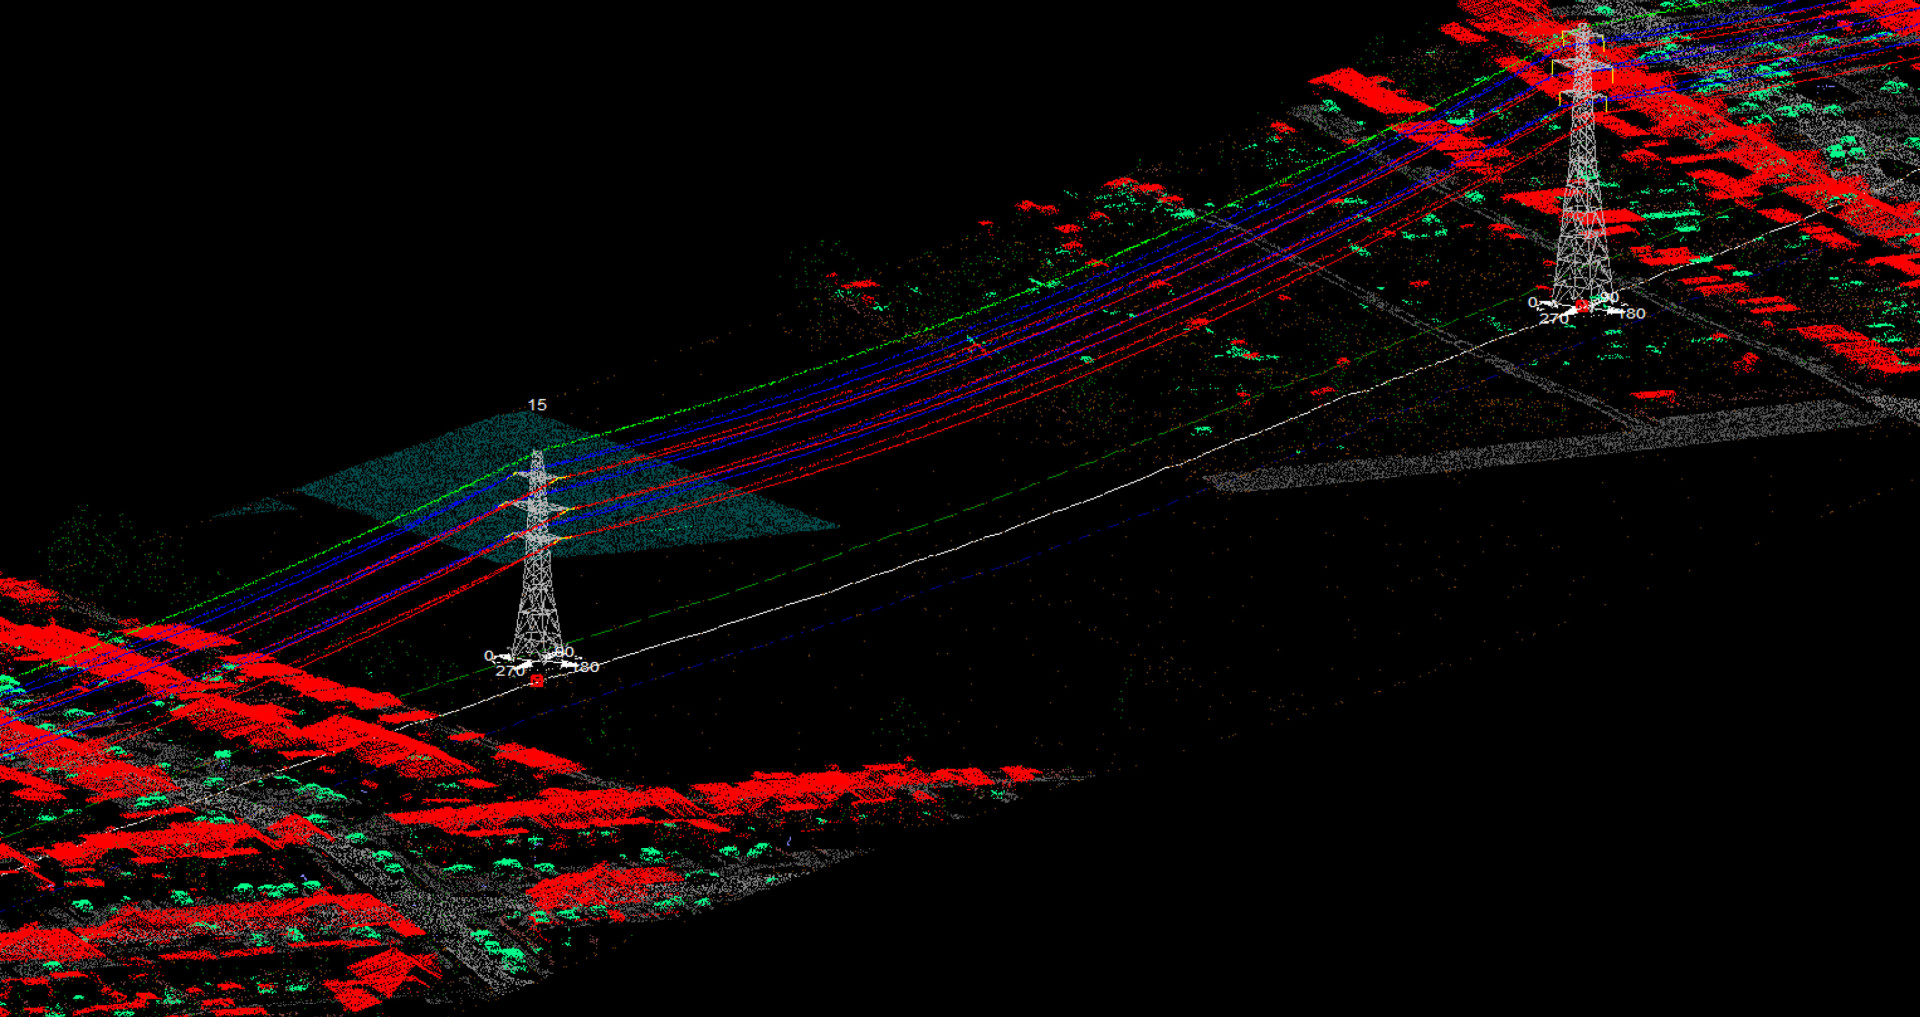
The third stage is to actually model the transmission or distribution circuits within PLS-CADD™. Firstly, we create an alignment by assigning a point at the base of each tower or pole and then placing dummy structures at those points. These can take the form of two methods. The basic stick structure just represents the pole or tower location and height. Or the other type would be structurally accurate models of the towers (including all members etc.). If we take the more complex modeling route, this creates fully formed structures that can be used for structural analysis.
Once the structures are created, we locate the attachment points to the insulator for each and string the conductor between those points, sagging them to the as-surveyed position.
“There are automatic processes, but a lot of it takes a skilled technician to complete the task.”
Finally using weather data and circuit load data we can then calculate the temperature of the conductors to provide a model of the conductors at max operating temperature. There are a number of products that we then create at the back end of the PLS-CADD™ process. Clearance reports show whether the line is safe under a particular condition; for example, at a certain thermal rating or taking into account a specific wind loading. Doing this means we can manipulate the model to inform a client how close the conductors would be to trees or buildings.”
Find out more about the services we offer electricity utilities