Utility vegetation management
NM Group provides functional reporting and utility vegetation management services. Our insights help utilities to prioritize vegetation encroachments, reduce operational costs and ensure regulatory compliance.
Our services deliver functional information to help utilities better manage the risk posed by vegetation-related outages. It’s vital to be able to target utility tree trimming, tree removal and vegetation maintenance effectively.
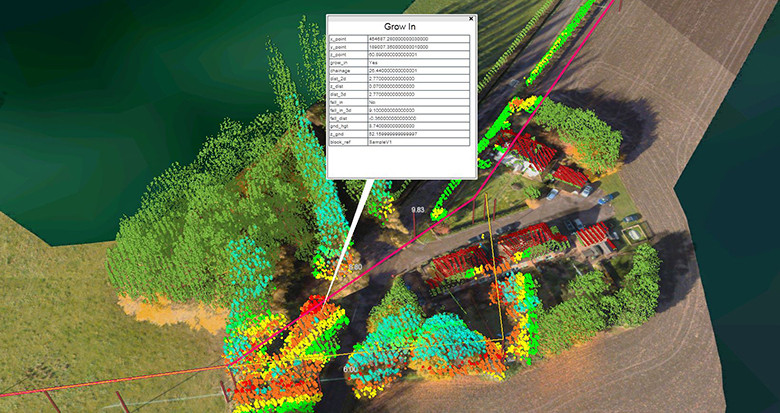
NM Group delivers the precise location of danger trees and grow-in infringements. This enables vegetation managers to build the most cost-efficient utility vegetation management plan and deliver on health and safety requirements.
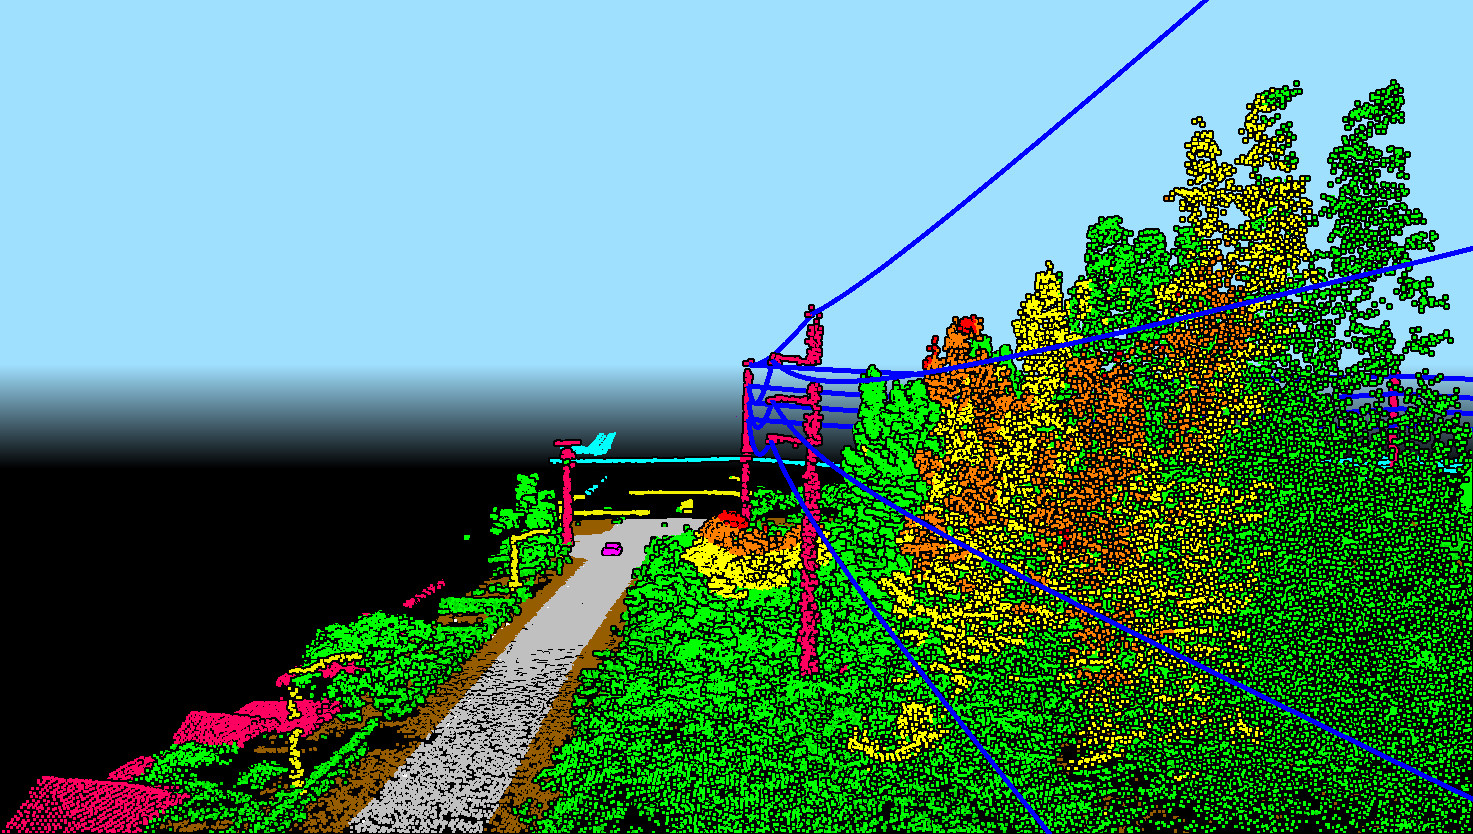
The LiDAR mapping we employ has proven to be a vital tool for vegetation control around utility infrastructure such as powerlines. Our advanced mapping provides a highly valuable insight that clearly identifies and measures risk.
Using our revolutionary reports, utility vegetation management can be prioritized to ensure optimum efficiencies for management teams.
Key Benefits of our Vegetation Management Services
Fast Results - We have the ability to provide fast results at a lower accuracy (Rapid Vegetation) or highly accurate comprehensive reporting.
Cost Reduction - We have helped our clients to reduce their vegetation management costs by up to 40%.
Compliance - Our innovative vegetation management solutions will help you to ensure you remain compliant with all relevant regulations.
Manage Risk - Our sophisticated vegetation mapping codes and identifies encroaching vegetation to help you set priorities. This includes mapping tree fall likelihood targets high-risk spans to ensure reliability and prepare for storm events.
Flexibility - Vegetation reports are available in a wide range of formats to suit your individual requirements.
Quality - All data is simple to interpret and highly actionable so you can focus on doing your job. Using 3D Models and sensor surveys, we will ensure the results are as clear as possible.
Accessibility - Airborne surveys means we can collect data from areas that are logistically challenging or dangerous to access on foot. It also is entirely non-intrusive and avoids landowner access issues.
Rapid Vegetation Reporting
Our rapid vegetation service enables network operators to get fast results on critical vegetation infringements.
This doesn’t rely on full-scale CAD modeling to determine how close vegetation is to the wires. Our innovative process doesn't model the network but uses the time-of-flight survey data to enable rapid vegetation reporting.
Because the data is available quickly it enables utilities to begin targeting the highest priorities ahead of the more comprehensive clearance modeling.
Data can be delivered in a lightweight 3D web viewer from 2-4 weeks following the survey flight.
Vegetation Management FAQs
What is vegetation management?
Vegetation management is the process of controlling trees and other plants, in order to prevent the undergrowth from damaging infrastructure and disrupting a key service.
The clearance of encroaching vegetation is hugely important for those tasked with the smooth running of utility infrastructure. Ensuring the risks posed by vegetation are kept in check, vegetation managers can play a vital role in minimizing outages and ensuring service reliability and safety.
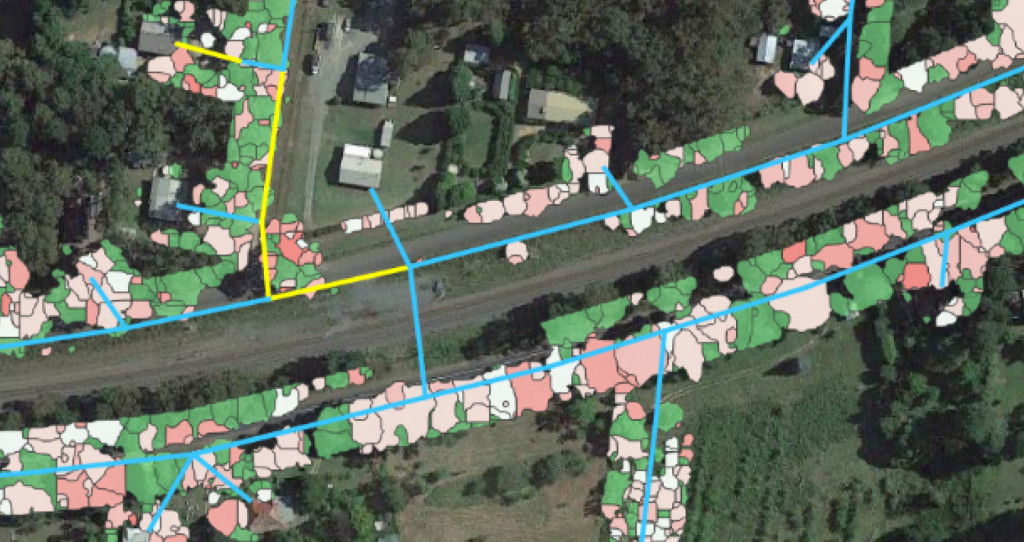
Vegetation mapping services have become a major component of a successful utility vegetation management plan. This is because they highlight areas of the line most at risk and allow maintenance teams to prioritize and use their budgets more efficiently.
How does our vegetation mapping and reporting work?
Our vegetation management software encompasses surveys using LiDAR and other sensors. We also assess clearances to your vegetation regulation requirements (such as NERC FAC-003) and provide clear, effective reporting for your business.
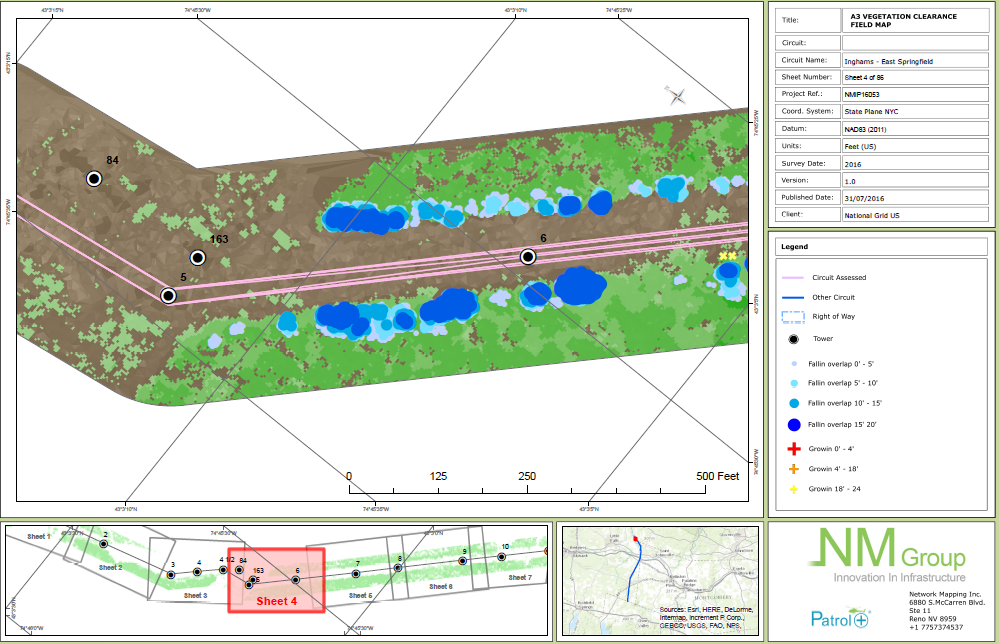
NM Group offers utility vegetation reports in a wide variety of formats. From hard copy sheets, spreadsheets, direct input files for GIS use and even our custom software, Caydence.
How long following a survey before you can get answers?
Each network is different, the kinds of reporting or analysis differ and the size of the project has an impact. Most things are possible - but the more sophisticated and the faster the turnaround, the more the cost goes up. However, a fairly ‘rough and ready’ response is possible in around two weeks, with lower absolute accuracy and simple classification.
A more sophisticated level of modeling and accuracy should be achievable in 4-8 weeks. A full set of dynamically modeled lines and near 100% accuracy for sophisticated clearances should be available in 6-10 weeks.
What point density do you need for UVM?
You really don’t need many points to define vegetation - 6ppm (emitted) upwards can do that. The quality of those points may vary though - are you seeing multiple returns through the canopy as well, to hit lower branches?
However, what often tends point density upwards is the need to reliably measure the conductors themselves, to enable the clearance measurement. Typically, we observe that when flown at 15ppm or greater with a suitable sensor geared towards fine wire measurement, you will see a good definition.
Of course, not all points are equal. In addition to density, you must consider the number of hits on each phase. You also must look at the consistency of the point spacing pattern and any shadowing related to aircraft position relative to the line.
Can you see dead or dying trees?
Understanding which trees are in poor health can be used as an indicator of which trees pose the greatest threat to a network. By simply looking through at the point cloud or imagery you can see dead or dying trees. However, the huge volumes of data make this impractical for visual interpretation.
Although it is difficult to pinpoint exactly which trees are dying (many sick trees don’t have visible indicators) you may in some cases use multi-band imagery. Multi-band imagery is used to detect signs of ill health through a process called NDVI analysis.
Our preference is to build statistical models which allow us to effectively rank trees by their likelihood of falling. This takes into account localized patterns of fall in order to account for different species, climate and soil depth, among many other factors. These trees can then be managed or inspected by specialists to provide protection to overhead lines.
Can we detect tree growth?
Our analysis will allow you to determine which spans need cutting now and how many need cutting in X number of years. This could be done in several ways. Using existing growth models to determine a crude estimate of the average speed of tree species can be applied. But applying a broad brush estimate can be unhelpful – leading to overestimation (excess work is done) or underestimation (network is exposed).
It is also good practice to include management activity into this calculation to ensure growth isn’t calculated where manual intervention has taken place. A further refinement is to match annual meteorological patterns to observed growth, to enable refinements based on the long-term forecast.
Our analysis will allow you to determine which spans need cutting now and how many need cutting in X number of years. This could be done in several ways. Using existing growth models to determine a crude estimate of the average speed of tree species can be applied. But applying a broad brush estimate can be unhelpful – leading to overestimation (excess work is done) or underestimation (network is exposed).
How accurate are the results?
For power line vegetation management it is worth noting that both powerlines and trees move in the wind. The absolute survey accuracy for vegetation surveys will generally be in the order of 10-50cm depending on requirements.
Relative (that is, point to point or tree to line) accuracy will be significantly better - generally sub-10cm. However, in typical good survey weather, trees may still move by up to a meter. So a sensible buffer needs to be applied as you simply do not know if the tree was swaying towards or away from a line. The conductor can also move and the modeling technique must be considered as well. Is it being ‘returned to plumb’ or left wherever it was swaying at the time?
You can trust the results of LiDAR vegetation scoping - but the stated accuracy should be tempered against practical interpretation.
What is LiDAR?
The term LiDAR stands for Light Detection and Ranging. It is a remote sensing method, which can be carried out via terrestrial, aerial or mobile scanning. We essentially use vehicle mounted devices to capture accurate 3D data, in highly actionable positional data, which forms the basis of our analytical services.
Related services
Our Vegetation Analytics service allows our clients to predict vegetation risks beyond the here and now. This sophisticated vegetation management intelligence is driven by big data trends.
For example, being able to use expected growth for a span, based on historical trends, provides an indicator of how many years a tree might take to violate minimum clearances.
Applying this data helps our clients to plan further ahead and formulate an approach to vegetation management that will reduce risk and deliver the biggest efficiencies.