Geospatial analysis – using NDVI imagery in a tree inventory
By Sophie Davison – KTP associate
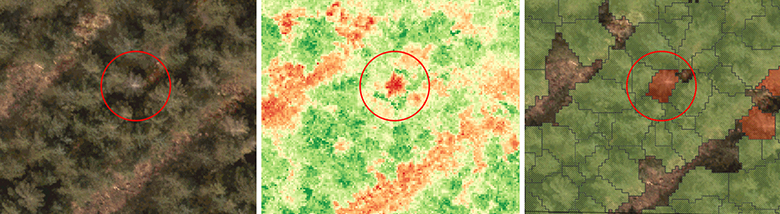
I recently posted a short article about using NDVI imagery to improve danger tree predictions on electricity networks. NDVIs are great for assessments of vegetation stress but how can this information be intelligently integrated into a GIS for vegetation management? These raster or pixel metrics can be generalized within geospatial objects such as polygon shapefiles. In the example shown below we have associated NDVI metrics with canopy objects, created by splitting up a detailed LiDAR point cloud into manageable units representing single trees or small groups of trees of a similar structure. With the attributed metrics these polygons can be styled in a GIS to clearly distinguish spectrally stressed trees.
We often attribute these canopy object shapefiles with a whole range of information generated from a LiDAR survey. For example fall-in or grow-in hazard presence, tree size metrics and terrain slope to name just a few. It starts to become really interesting when you begin to look at the interactions between the attributes. A canopy object that exhibits fall-in hazard presence, signs of spectral stress, and an asymmetric structure poses a greater risk to a powerline. Attributes can be combined using attribute calculators in GIS software to join, weight or transform as many as you might like to report on the data in innumerable ways!