The future of utility vegetation risk modeling – Part 2
By Shane Brunker, Technical Director at NM Group
In Part 1, I explained the rationale for a new approach to vegetation risk modeling, driven by the way we can quantify and manage threats to a safe and reliable electrical network. Now in Part 2, I am going to explore specific elements of the model in detail.
Important aspects of the model
The key point of this model is that we aren’t just doing a ‘static’ assessment to show where vegetation is within statutory (or other) boundaries. What we are doing is a full risk assessment to guide decision making.
A vital element in successfully implementing models like this is embracing cloud technologies, in order to enable efficient and cost effective process flows. This has the utility network operations defining the suite of statutory requirements and policy to define a set of rules. Industry then designs a suite of scheduled remote sensing (i.e. LiDAR, hyperspectral) and IoT (i.e. meteorological, line load) activities that collect the required data. Cloud based applications apply the rules to the data inputs and rapidly feed findings back to utility users, in stand-alone apps and direct to work management and planning systems.
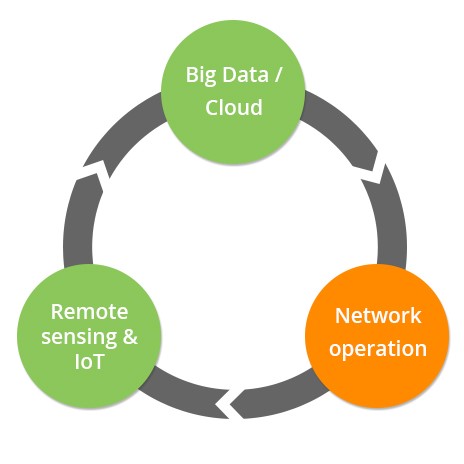
A simplified circular process
Practical process flows
Going further, this represents a five step process to enable full oversight of the network vegetation risk:
- Data sourcing – continuously collecting/downloading data from a range of internal and external sources
- Risk modeling – using weighted risk algorithms which have been adjusted according to field verification to process/analyze the remote sensing/IoT information.
- Balancing cost/risk – using decision support tools that allow the vegetation and asset strategists to optimize management activities, such as cut back levels based on expected growth, which will drive risk
- Issue work requirements – using the risk/cost balancing outputs to decide what work needs doing, when and where
- Monitor and report – on what has been collected, analyzed and actioned, through dashboards and summary statistics
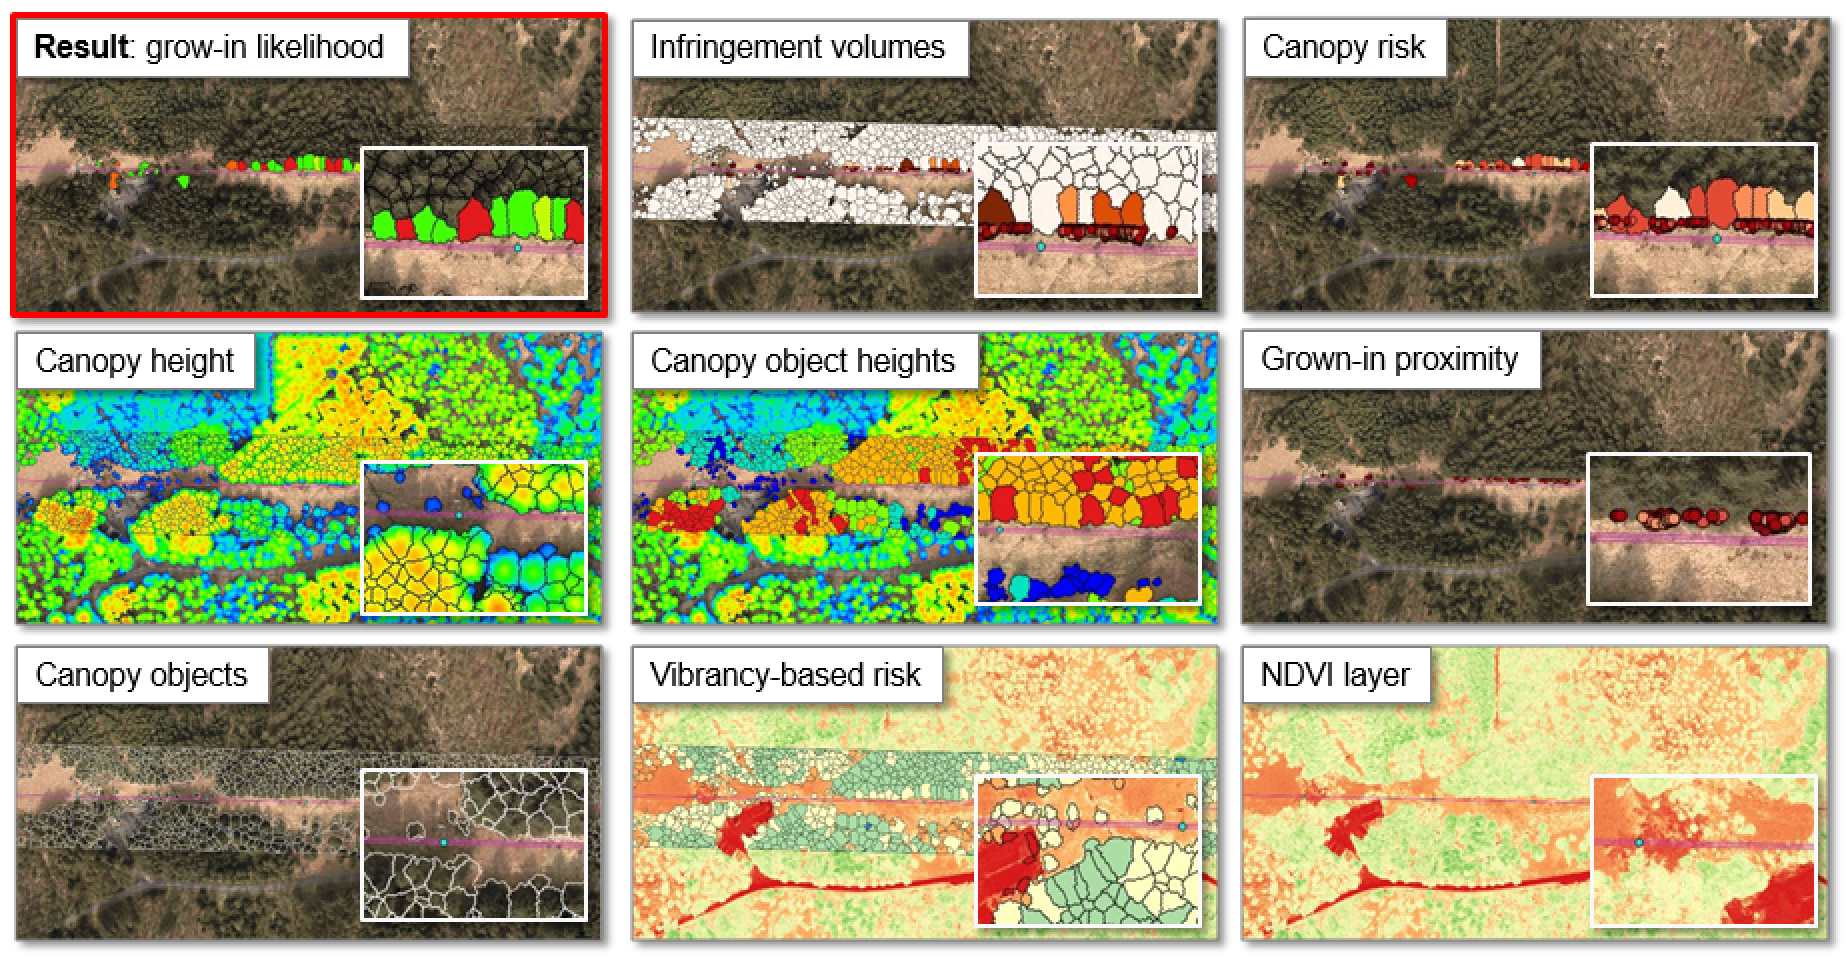
An example suite of layers generated as part of grow-in risk modeling
The risk models themselves
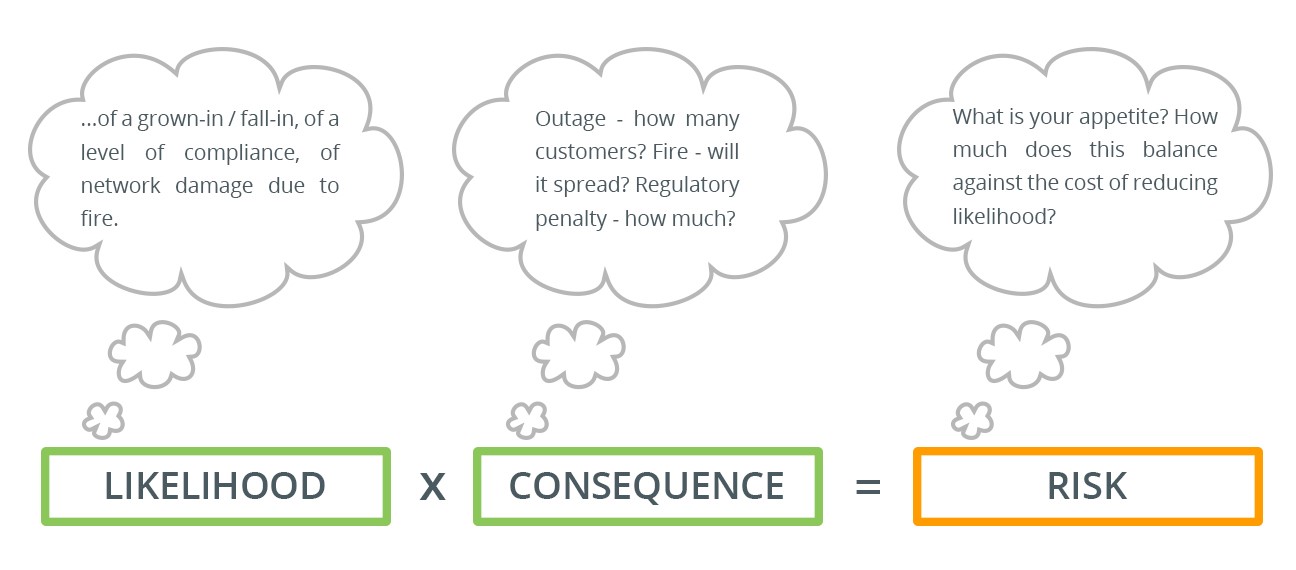
These have been put together based on the body of forestry and risk management literature and practice, in order to create a practical suite of turn-key models. Using a range of likelihood (for grow in and fall in) and consequence (outage impact, fire risk, etc.) calculations, the models are adapted to account for local factors. This includes vegetation species, terrain and geography and the different characteristics driving both probability of incident (i.e. tall trees off the ROW) and the consequence of one (i.e. a HV line outage with a major regulatory penalty).
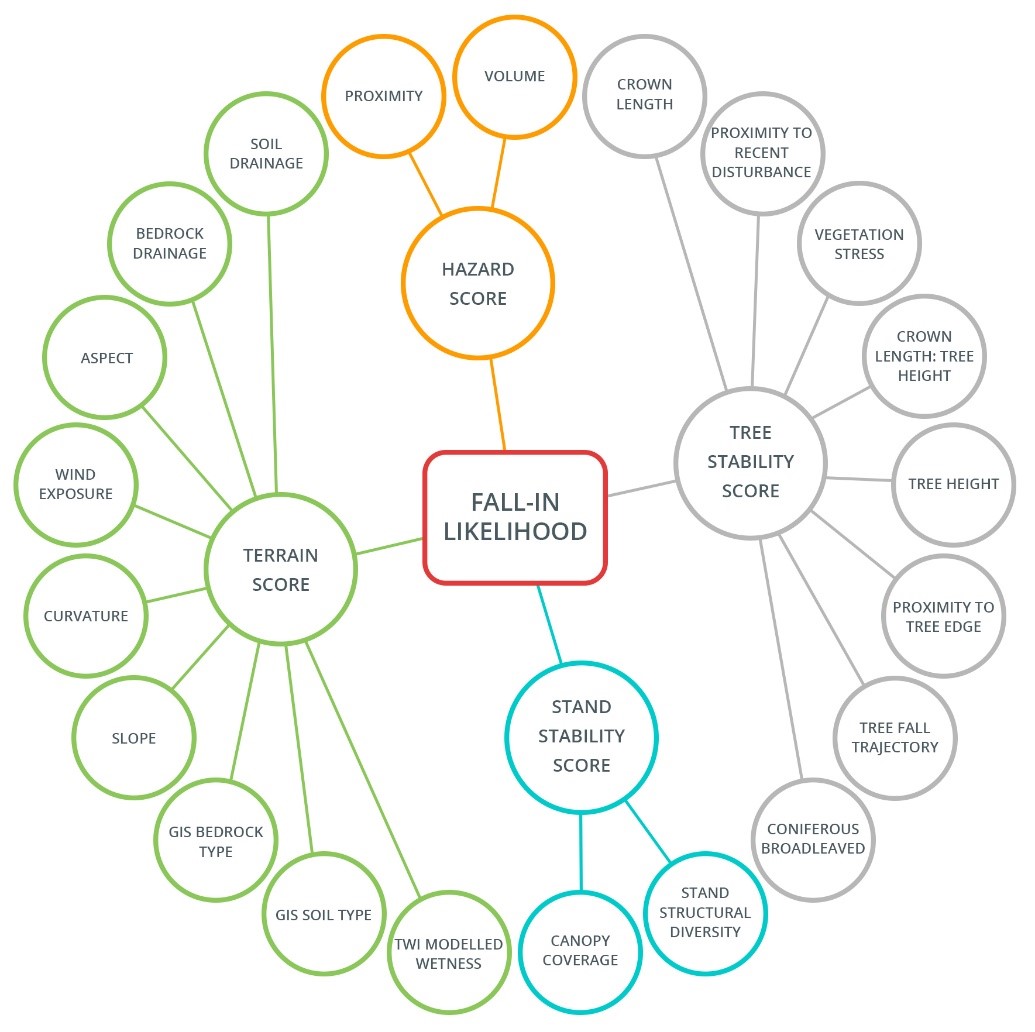
An example of some of the layers available for input to the fall-in risk model
Final thoughts
This is clearly a whistle-stop tour of a sophisticated set of processes governing an equally sophisticated set of risk models. Nevertheless it should give a good indication of how the risk-based approach can be applied to vegetation management on utility networks. It’s about linking the enabling technology to practical utility policy and then to a robust business process – the detail of which is the subject of part three of this series.
Read more about vegetation analytics here.