Top five LiDAR Utility Vegetation Management questions
The use of LiDAR for vegetation management is commonplace, with many utilities using the technique to inform how they manage tree risk. However, despite this, there are a number of questions and misconceptions around using the technology for UVM purposes. So here are five frequent questions we get asked by network operators.
1) How long following a survey before you can get answers?
Timescales are always a difficult question as we aren’t talking about commodities here. Each network is different, the kinds of reporting, or analysis differ and the size of the project has an impact. Most things are possible - but the more sophisticated and the faster the turnaround, the more the cost goes up. However, a fairly ‘rough and ready’ response is possible in less than two weeks, with lower absolute accuracy and a simpler classification. A more sophisticated level of modeling and accuracy should be achievable in 4-6 weeks. A full set of dynamically modeled lines and near 100% accuracy for sophisticated clearances should be available in 6-8 weeks.
2) How accurate are the results?
It’s worth noting to start with that both powerlines and trees move in the wind - so this is partly a survey discussion and partly a discussion on pragmatic data interpretation.
The absolute survey accuracy for vegetation surveys will generally be in the order of 10-50cm depending on requirements. Relative (that is, point to point or tree to line) accuracy will be significantly better - generally sub-10cm. However, in typical good survey weather, trees may still move by up to a meter - so a sensible buffer needs to be applied as you simply do not know if the tree was swaying towards or away from a line. The conductor can also move and the modeling technique must be considered as well - is it being ‘returned to plumb’ or left wherever it was swaying at the time?
You can trust the results of LIDAR vegetation scoping - but the stated accuracy should be tempered against practical interpretation.
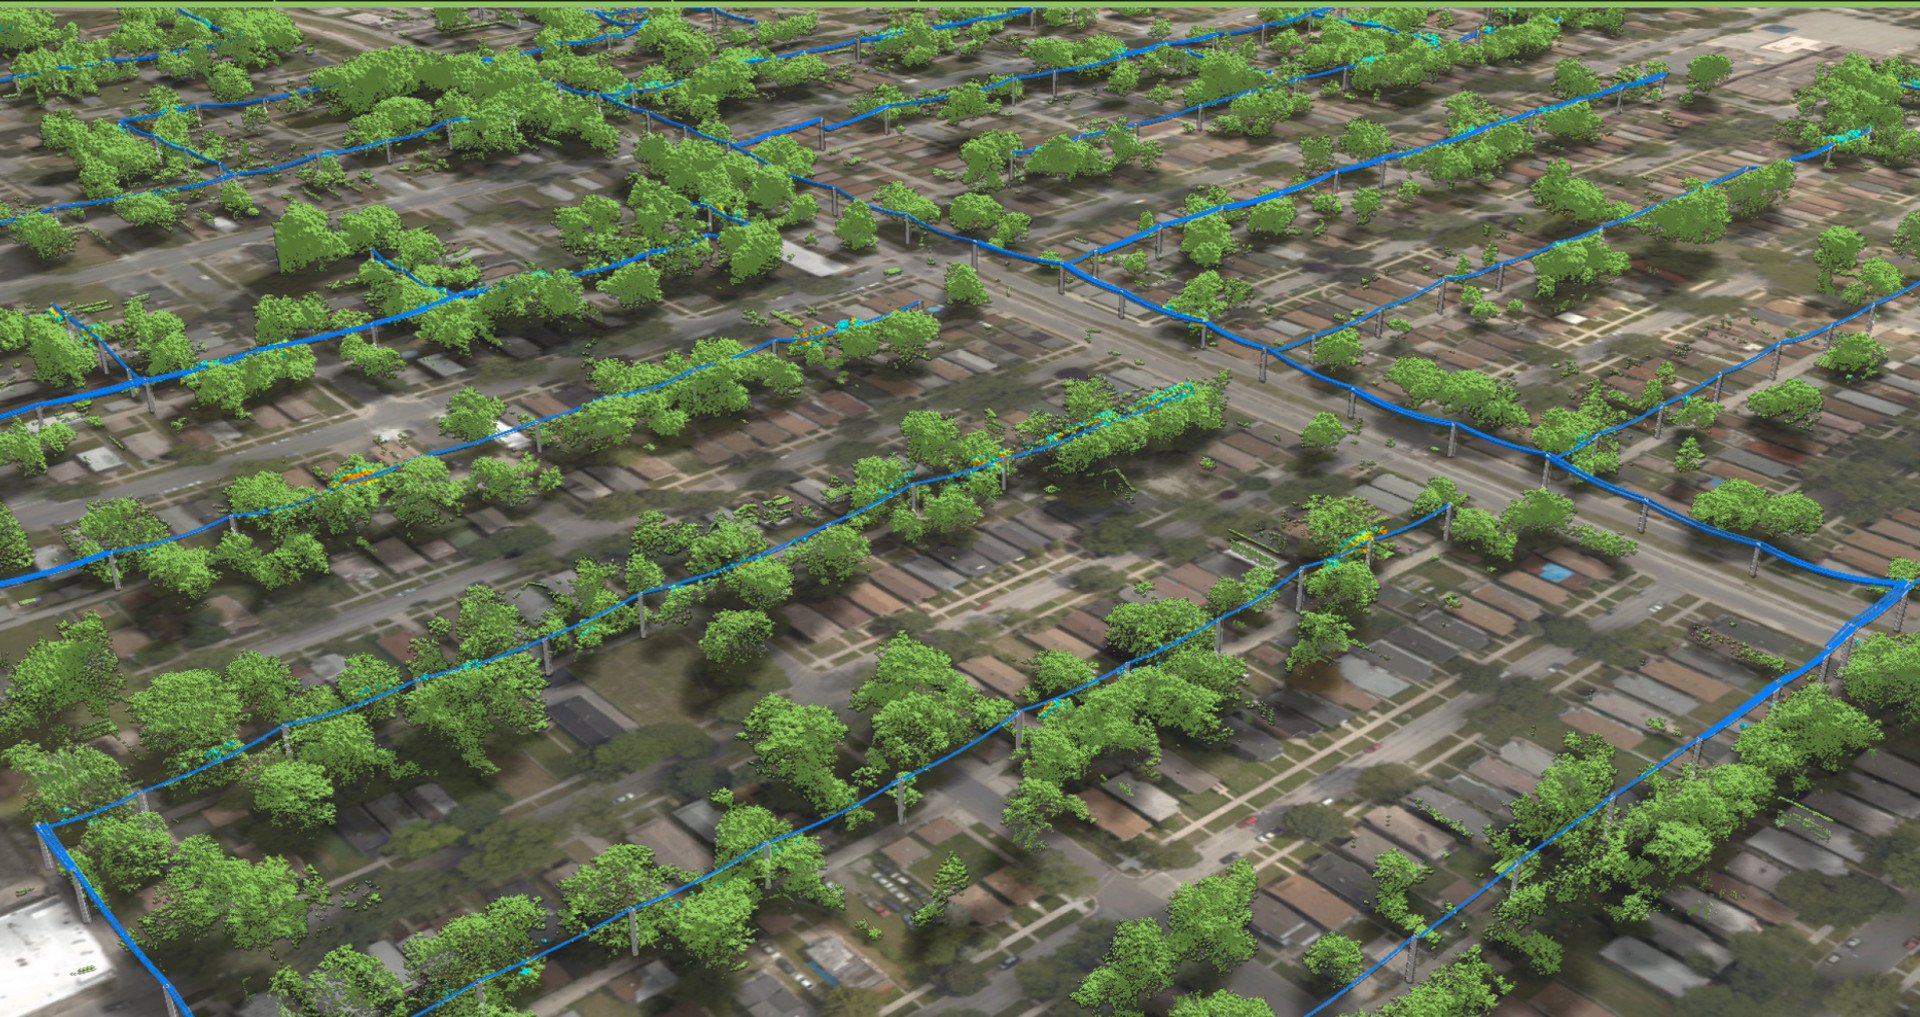
3) What point density do you need for UVM?
You really don’t need many points to define vegetation - 6ppm (emitted) upwards can do that. The quality of those points may vary though - are you seeing multiple returns through the canopy as well, to hit lower branches?
However, what often tends point density upwards is the need to reliably measure the conductors themselves, to enable the clearance measurement. Typically, we observe that when flown at 15ppm or greater with a suitable sensor geared towards fine wire measurement, you will see a good definition. Of course, not all points are equal - so in addition to density you must consider the number of hits on each phase, the consistency of the point spacing pattern and any shadowing related to aircraft position relative to the line.
4) Can you see dead or dying trees?
This is a very common question. Understanding which trees are in poor health can be used as an indicator of which trees pose the greatest threat on a network. By simply looking through at the point cloud or imagery you can see dead or dying trees - but the huge volumes of data make this impractical for visual interpretation.
Although difficult to pinpoint exactly which trees are dying (many sick trees don’t have visible indicators) you may in some cases use multi-band imagery to detect signs of ill health through a process called NDVI analysis.
Our preference is to build statistical models which allow us to effectively rank trees by their likelihood of falling. This takes into account localized patterns of fall in order to account for different species, climate and soil depth, among many other factors. These trees can then be managed or inspected by specialists.
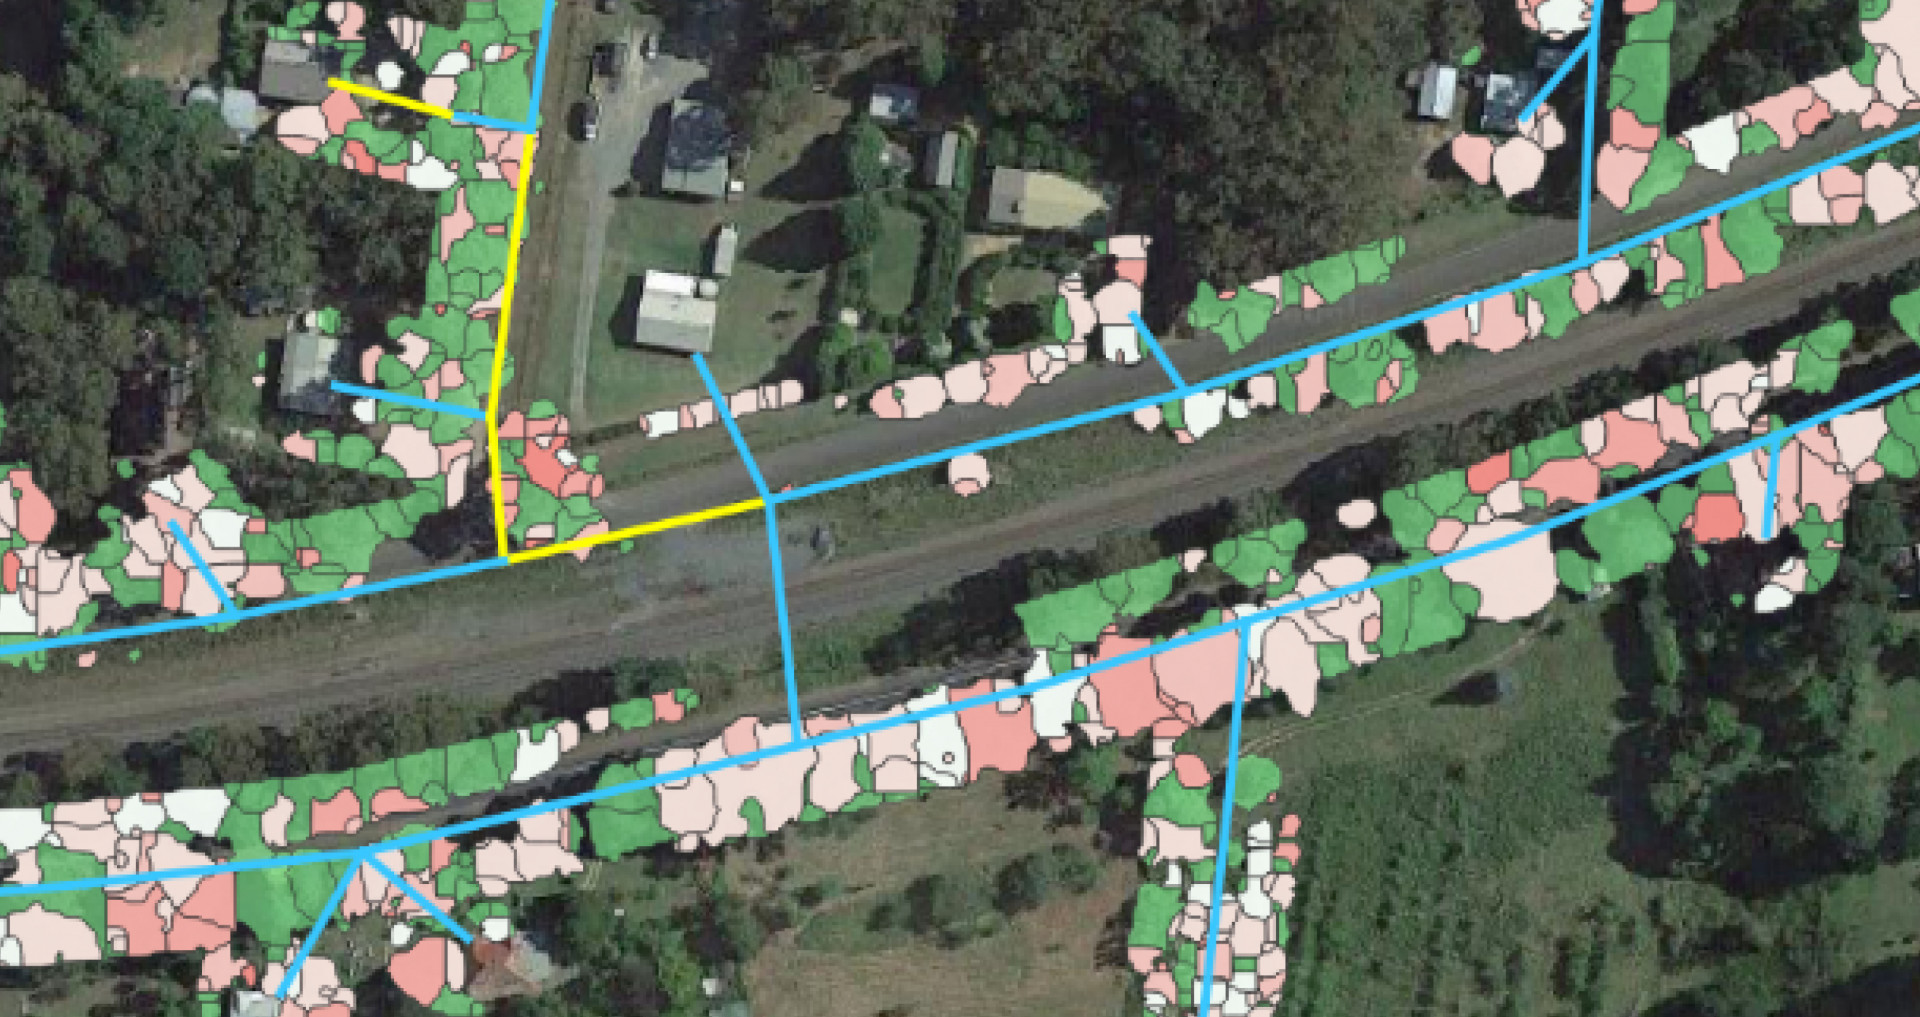
5) Can we detect tree growth?
This is often asked in terms of how can we determine which spans need cutting now and how many need cutting in X number of years. This could be done in several ways. Using existing growth models to determine a crude estimate of the average speed of tree species can be applied. But applying a broad brush estimate can be unhelpful – leading to over estimation (excess work is done) or underestimation (network is exposed). By using LiDAR to measure the observed growth of vegetation towards the conductor the trees are measured in the very conditions they are likely to continue to grow in rather than in a generalized fashion. It is also good practice to include management activity into this calculation to ensure growth isn’t calculated where manual intervention has taken place. A further refinement is to match annual meteorological patterns to observed growth, to enable refinements based on the long term forecast.
Being able to use expected growth for a span, based on historical trends, provides an indicator of how many years a tree might take to violate minimum clearances.
Did we miss one? Submit this to us at info@nmgroup.com and we can include this in a follow up blog.