Vegetation canopy attribution in Caydence
LiDAR data can be used to create a precise vegetation canopy object for understanding the number, size and volume of trees within a powerline corridor. The following images show how this can be access within Caydence® our 3D asset management system.
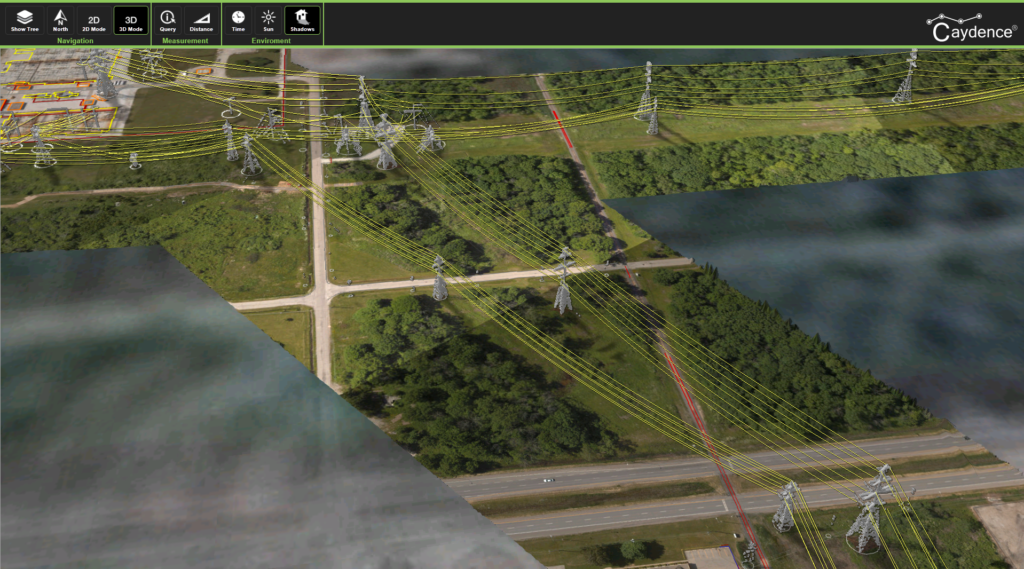
The towers and wires are displayed in 3D.
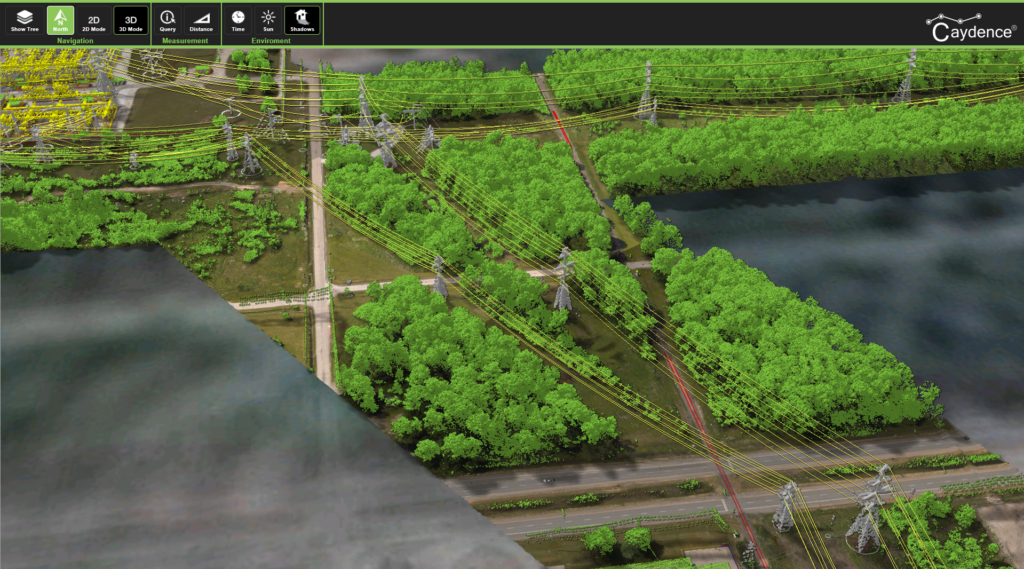
LiDAR data is populated for the transmission corridor, showing the location of vegetation and other site features.
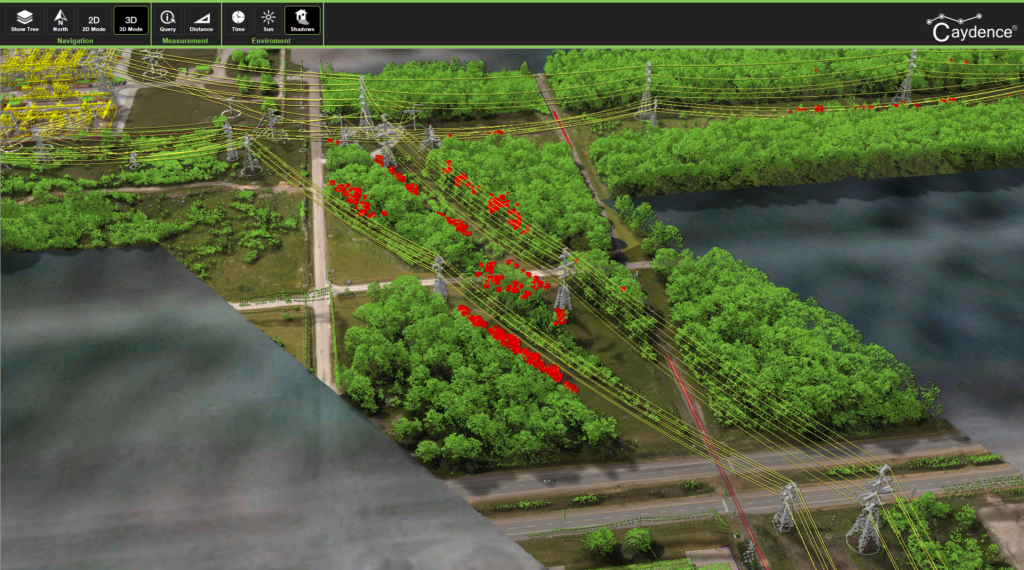
Following a processing workflow any vegetation encroachments can be visualized as a red point on the vegetation.
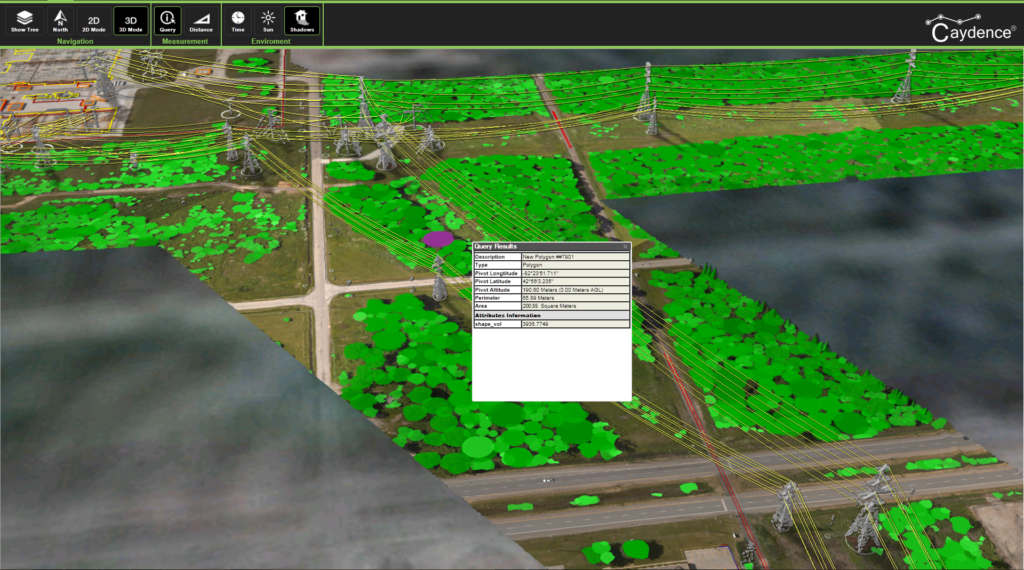
Finally, with the vegetation LiDAR data removed we can convert the LiDAR point data into individual tree canopy objects. They include attribution such as height, area and volume.
Find out more about our vegetation analytics.