Can NDVI imagery improve danger tree predictions for electricity networks?
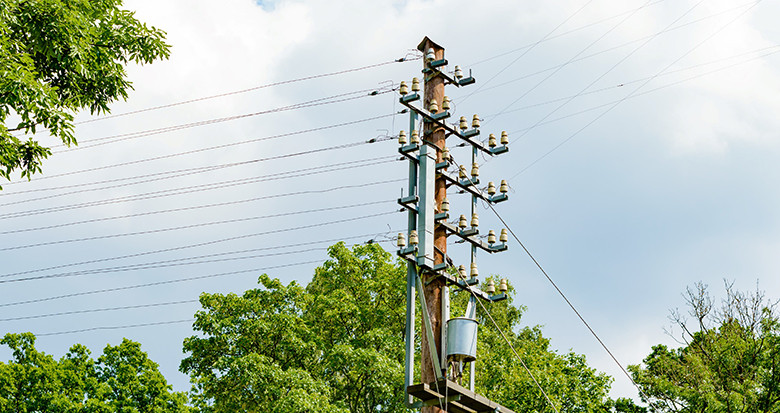
Vegetation is a constant threat to overhead power lines, with distribution networks particularly at risk due to generally high numbers of ‘danger trees’. This means that a reliable method to prioritize tree management is absolutely crucial to ensure network resilience. Many utilities have identified NDVI analysis as an indicator of poor tree health. This can then be used as a way to prioritize vegetation removal, but I think there is more that can be done. Our ongoing research shows that although this is an important component in prioritizing a tree’s fall-in risk it is not the whole story.
What is NDVI analysis?
The Normalized Difference Vegetation Index (NDVI) is a ratio which utilizes the inverse relationship between red and near-infrared wavelengths to indicate areas of potentially stressed vegetation. Greater chlorophyll presence in leaves (linked to healthier vegetation) strongly absorbs visible light and the cell structure of the leaves strongly reflects near-infrared light. A comparatively low NDVI value over a vegetated area could be an indication of stress through lack of water or disease for example.
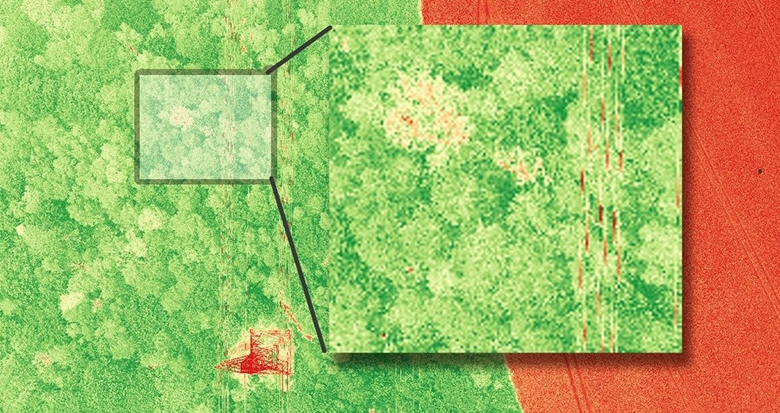
Example of NDVI analysis showing indicators of vegetation stress
How can this be applied to vegetation risk analysis?
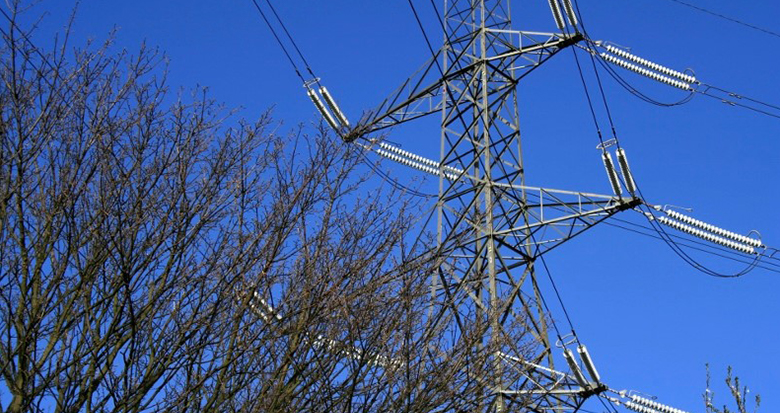
A four band camera, with the ability to record the red, green, blue and near-infrared spectral wavelengths, can be integrated with a LiDAR system during an aerial survey project. The LiDAR data can be used to identify all danger trees posing a risk to the surveyed powerlines and the imagery produced from the four band camera, utilized in the form of an NDVI, can indicate danger tree stress. Trees that are both danger trees and showing signs of stress could be less structurally stable and when considered together pose an even higher risk to the power network.
NDVI imagery is only part of the analysis
There are limitations as to what information can be provided from NDVI. The value obtained from one pixel in an NDVI is not useful when considered alone. It needs to be compared to vegetation along the power corridor to be valuable. Furthermore NDVI cannot discern between localized health conditions such as root rot or trunk rot and if health conditions are present but show no foliar symptoms they will not be identified with this method.
The interpretation of NDVI images can also be complex and will vary depending on season. Low NDVI values are not always good indications of poor health, as trees often begin to lose vigor upon reaching maturity. In contrast an absence of low NDVI values is not necessarily an indication of good health. Trees can be in poor health and show no visual symptoms and ‘healthy’ trees can still fall.
The conclusion on fall-in risk assessments
Trees displaying signs of ill health are, of course, a high fall concern and NDVI images can be effective in identifying vegetation under stress. However these metrics should not be considered in isolation to determine tree fall risk. There is a wealth of information available from within the LiDAR point cloud, such as incredibly detailed representations of the topography and the trees themselves that can and should be harnessed. At NM Group we’re working on pulling together these and additional factors with NDVI health inferences to further improve vegetation risk analysis.
Integrating better estimates of tree fall likelihood along with intelligence surrounding the consequences should the hazard occur (such as customer base impacted or the proximity to high value assets) we can obtain a better understanding of the risks involved than using NDVI imagery alone. Further research is being undertaken as part of our continuing Knowledge Transfer Partnership and the results will feed into our analytics.
Find out more about our vegetation analysis for electricity network providers here.