Using LiDAR and Spatial Analytics to Reduce Tree-Related Outages
Most utilities identify and remove tree hazards as part of their normal vegetation management operations. Traditionally, utility arborists and environmental experts would patrol all overhead lines and use reported fault information to identify problem areas. The monetary and logistical expense of this is significant. This is driving a move to the use of more sophisticated management approaches. Network operators are now turning to remote sensing, GIS spatial analytics and data to improve their analyzes. This approach enhances optimization of resources while reducing the costs and potential negative publicity associated with power outages. This article looks at a recent study into how data can be used more effectively to remove vegetation threats.
The Test Area
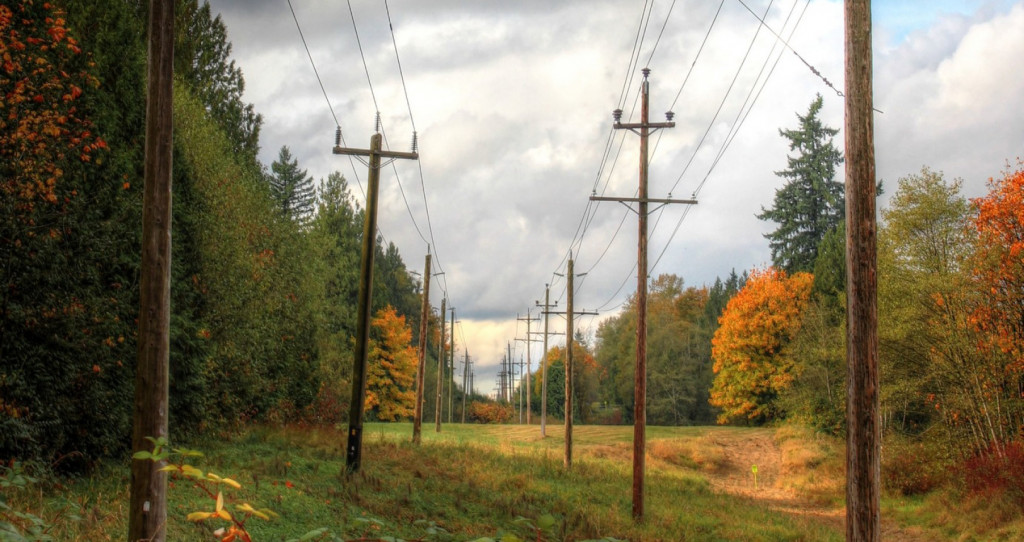
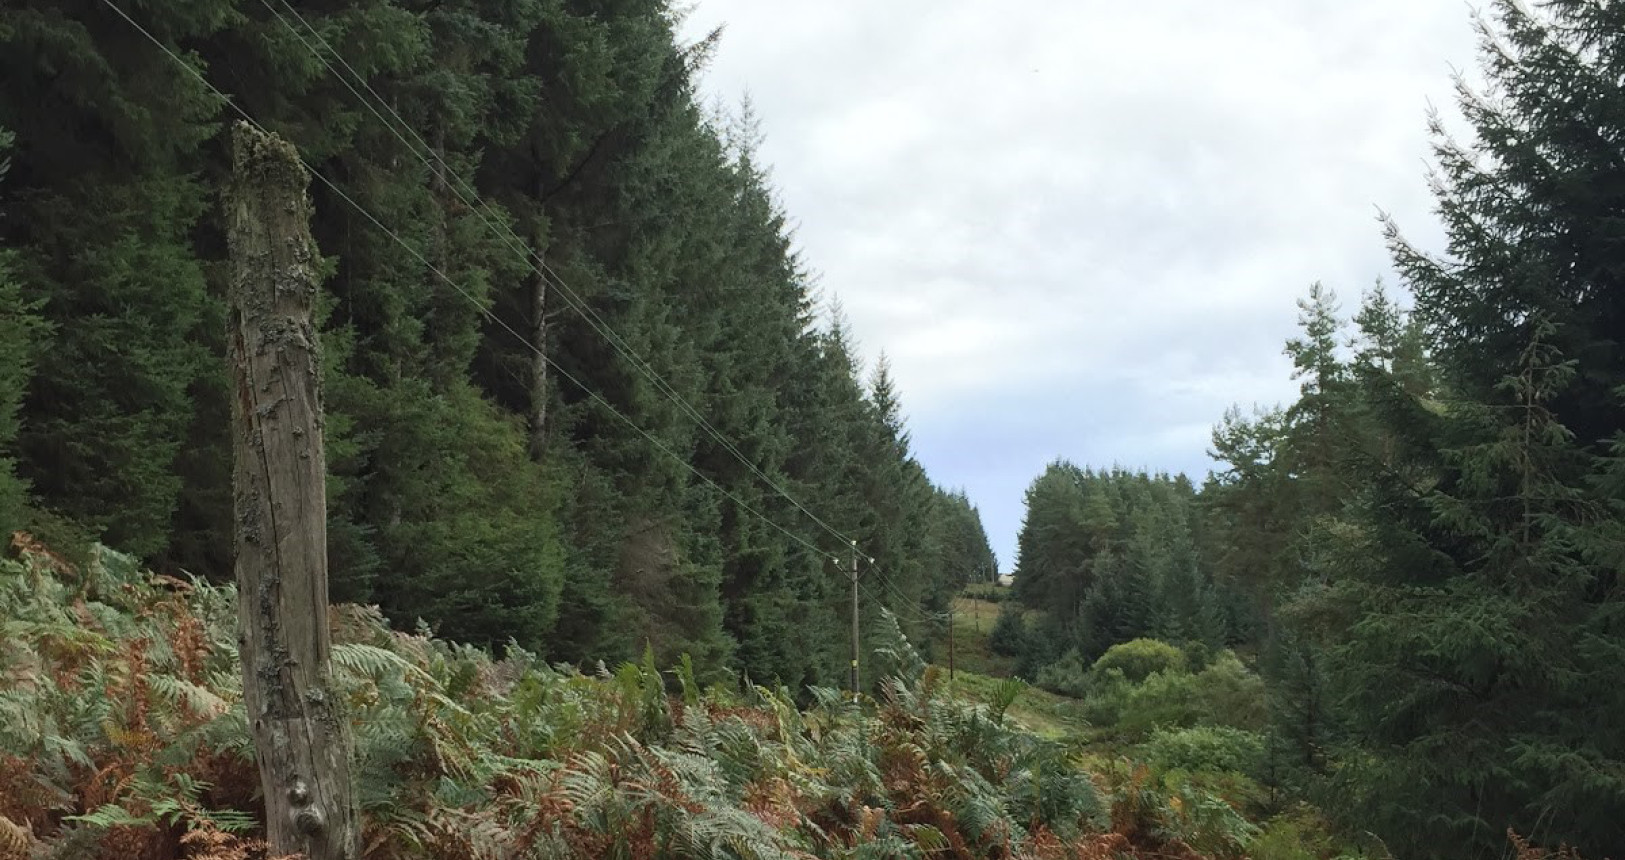
Kielder Forest was one of many study areas used for research undertaken as part of a Knowledge Transfer Partnership with Durham University. Kielder Forest has naturally high water tables and low soil nutrient levels. As a result, cultivation, soil drainage and fertilization is used to manage this. Nevertheless, despite this proactive effort tree fall remains a problem due to high wind exposure and the shallow rooting of many species. Power lines running through the forest have a very high exposure to this tree fall risk and so the issue of tree fall is not only of importance for the commercial foresters of Kielder, but also for a network operator trying to ensure resilient power supply.
The Solution
Looking for the trees posing the most risk to the powerline can be like looking for a needle in a haystack. When thousands and thousands of trees could be a risk, how do you prioritize vegetation management in a cost effective manner? For this project, NM Group used LiDAR to create a geospatial forest inventory and then incorporated open source datasets, aerial imagery and machine learning techniques to model which trees shared the structural and positional characteristics of fallen trees in the area.
Modeling historic patterns of tree fall against topography and forest structure information generated from LiDAR data, we were able to demonstrate that taller trees in less dense stands with reduced drainage and large wind exposure were more at risk of fall.
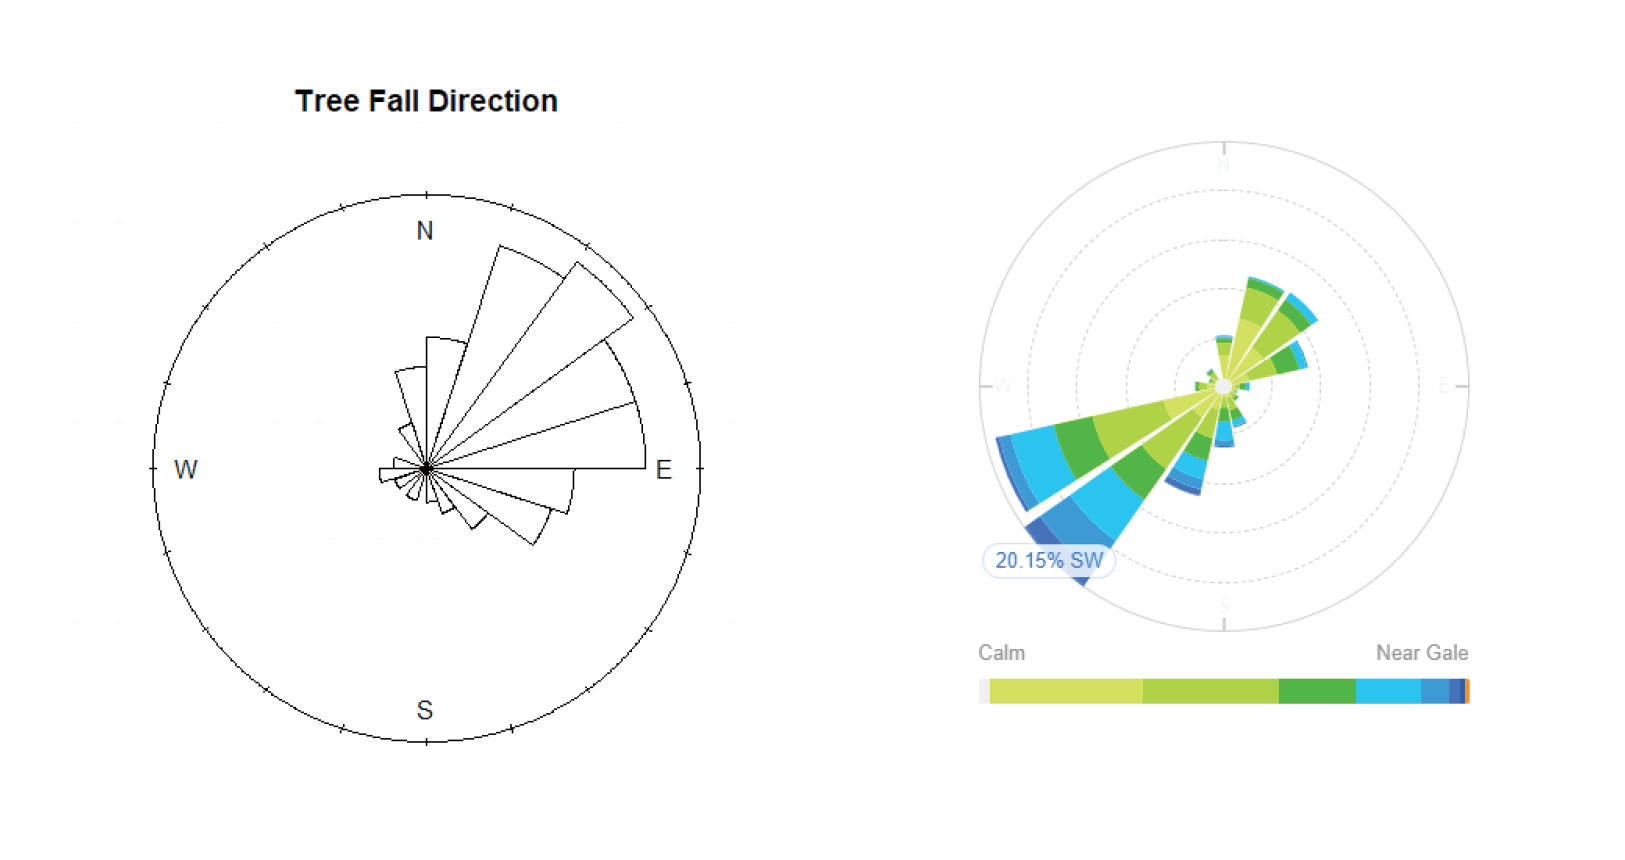 A rose diagram describing the direction of tree fall in the study area on the left and a 5-year average wind rose describing the direction wind originates from in the study area on the right.
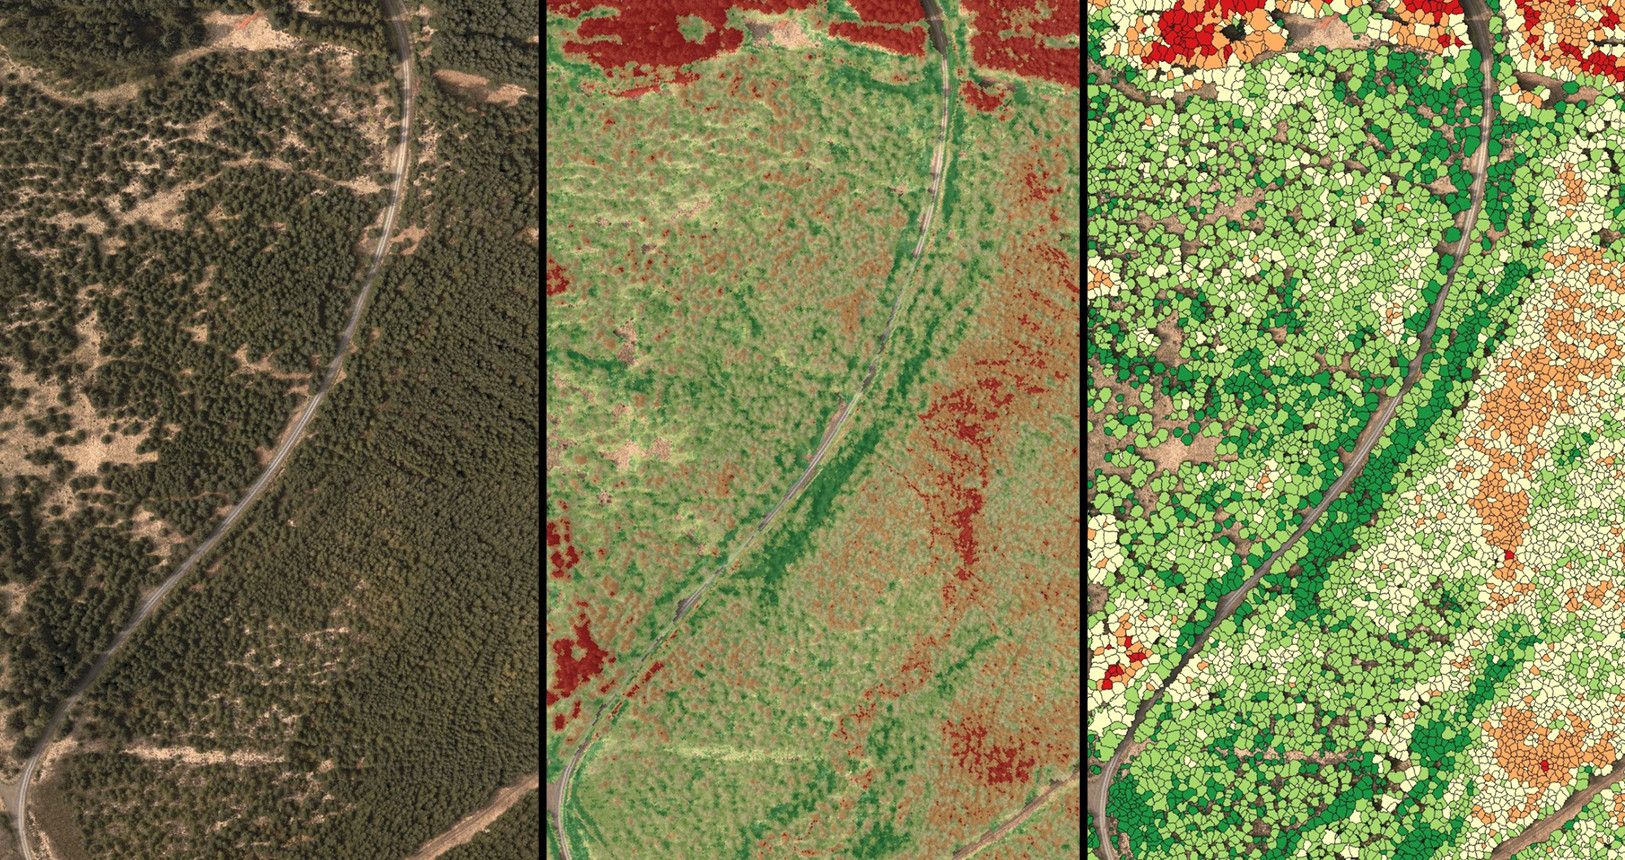
NM Group categorized the entire forest inventory by risk level, showing exactly which tree canopies had the highest risk of falling. So what does that mean? With a solid grasp on falling risk, utility staff could focus on removing trees in high-risk areas to reduce power outages and spend less in network areas with no or significantly, less threats, meaning a more targeted budget.
Why does this matter for utilities
Using data to prioritize work based on the level of risk provides key advantages to a network operator. Proactively addressing high-risk areas makes the network more resilient and avoiding cutting in areas of low or no risk means more effective use of budgets. Often this means a much lower amount needs to be spent on cutting trees. The net effect is dead or hazard trees can be removed on a planned basis before they create an outage.
This technique has been successfully implemented in the UK and Australia and there are a number of pilot projects underway in other parts of the world. Indeed its flexibility is one of the features that makes this approach valuable to network operators. Instead of relying on assumptions or generic data about the environment or a tree species, it uses precise, local data. Taking inputs from the network in question and utilizing analytics and machine learning principles, we are modeling specific factors that cause tree failure. Employing science to best inform the management of trees around the powerline.
Click here to read more about our Vegetation Management services.