Ask an Engineer part 5
How can we remember the complicated terminology associated with PLS CADD, such as M1, M2, M3 and M4 models?
If you’re an old hand at the software, these definitions will be absolutely clear to you and won’t require and explanation, if you are relatively new to the software, my advice is to not use them. Completely ignore the fact that L1 through 4 or M1 through 4 exist.
Don’t call them by the abbreviations, which may lead to misunderstanding. Call them by the purpose of the structure model or analysis that you are performing. That way you can avoid misunderstanding, and you will find that really soon all those weird L1’s and M4’s will stop being an arcane pursuit and become a convenient shorthand for something very meaningful.
Let’s start with the Structure Methods (that’s where the M comes from) and let’s forget about numbers and talk about meaning.
We are going to go through these Structure Methods one at a time, and without referring to M1, M2 etc. we are going to explain the different types of Structure Model, how those are defined, how they can be used and what are the advantages and disadvantages of each one.
Before we start, let’s discuss some terminology regarding span criteria.
Span Length
The span length is the horizontal (2D) distance between the center of one structure to the center of the next structure. The structure span length can be different from the circuit span lengths and the ‘inclined span length’.
Inclined Span Length
Is the true (3D) distance between the center of one structure to the center of the next structure.
Standard Span
Standard span is the distance between which two ‘standard height’ structures that the conductor can maintain the required clearance distance over level ground.
Wind Span
Wind Span is the ‘mean of the sum of adjacents’ or the back span plus the ahead span, all divided by two. As it is a function of geography the wind span does not change for different weather conditions.
Weight Span
The weight span is approximately equal to the horizontal distance between the low point in the left span and the low point in the right span often denoted by tick marks). These low points may exist within the span or may also exist outside the span, in the case of an uplift condition. As locations of low points move under different weather conditions there may be different values of maximum and minimum weight span depending upon the selected weather case.
Tension Section
A tension section is defined as the distance between dead ends, this should be similar to the sum of the span lengths in between dead-end structures.
Ruling or Equivalent Span
A mathematical representation of a weighted average. Thus:
RS = SQRT( {S14/C1 + S24/C2 + . . + Sn4/Cn} / {C1 + C2 + . + Cn} )
Where Si = Horizontal (2D) Projection or Span Length, and Ci = True (3D) or Inclined Span Length.
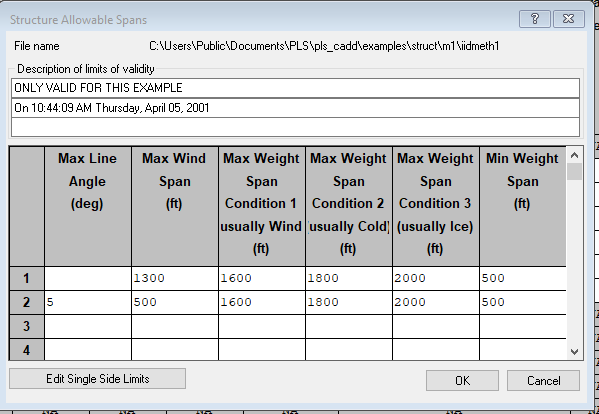
1. What do we mean by an allowable spans model?
Let’s take a look at an ‘allowable spans model’ and work out what’s going on. We can select the file ‘Litex1m1.loa’ from our example files in……\PLS\PLS_CADD\examples\projects (at least on my desktop)
The file opens up as shown below. We can see a profile view and a 3D view (which I have magnified and re-oriented) the structure shown has a shield wire, three red phase conductors on the Left circuit and three blue phase conductors on the right circuit.
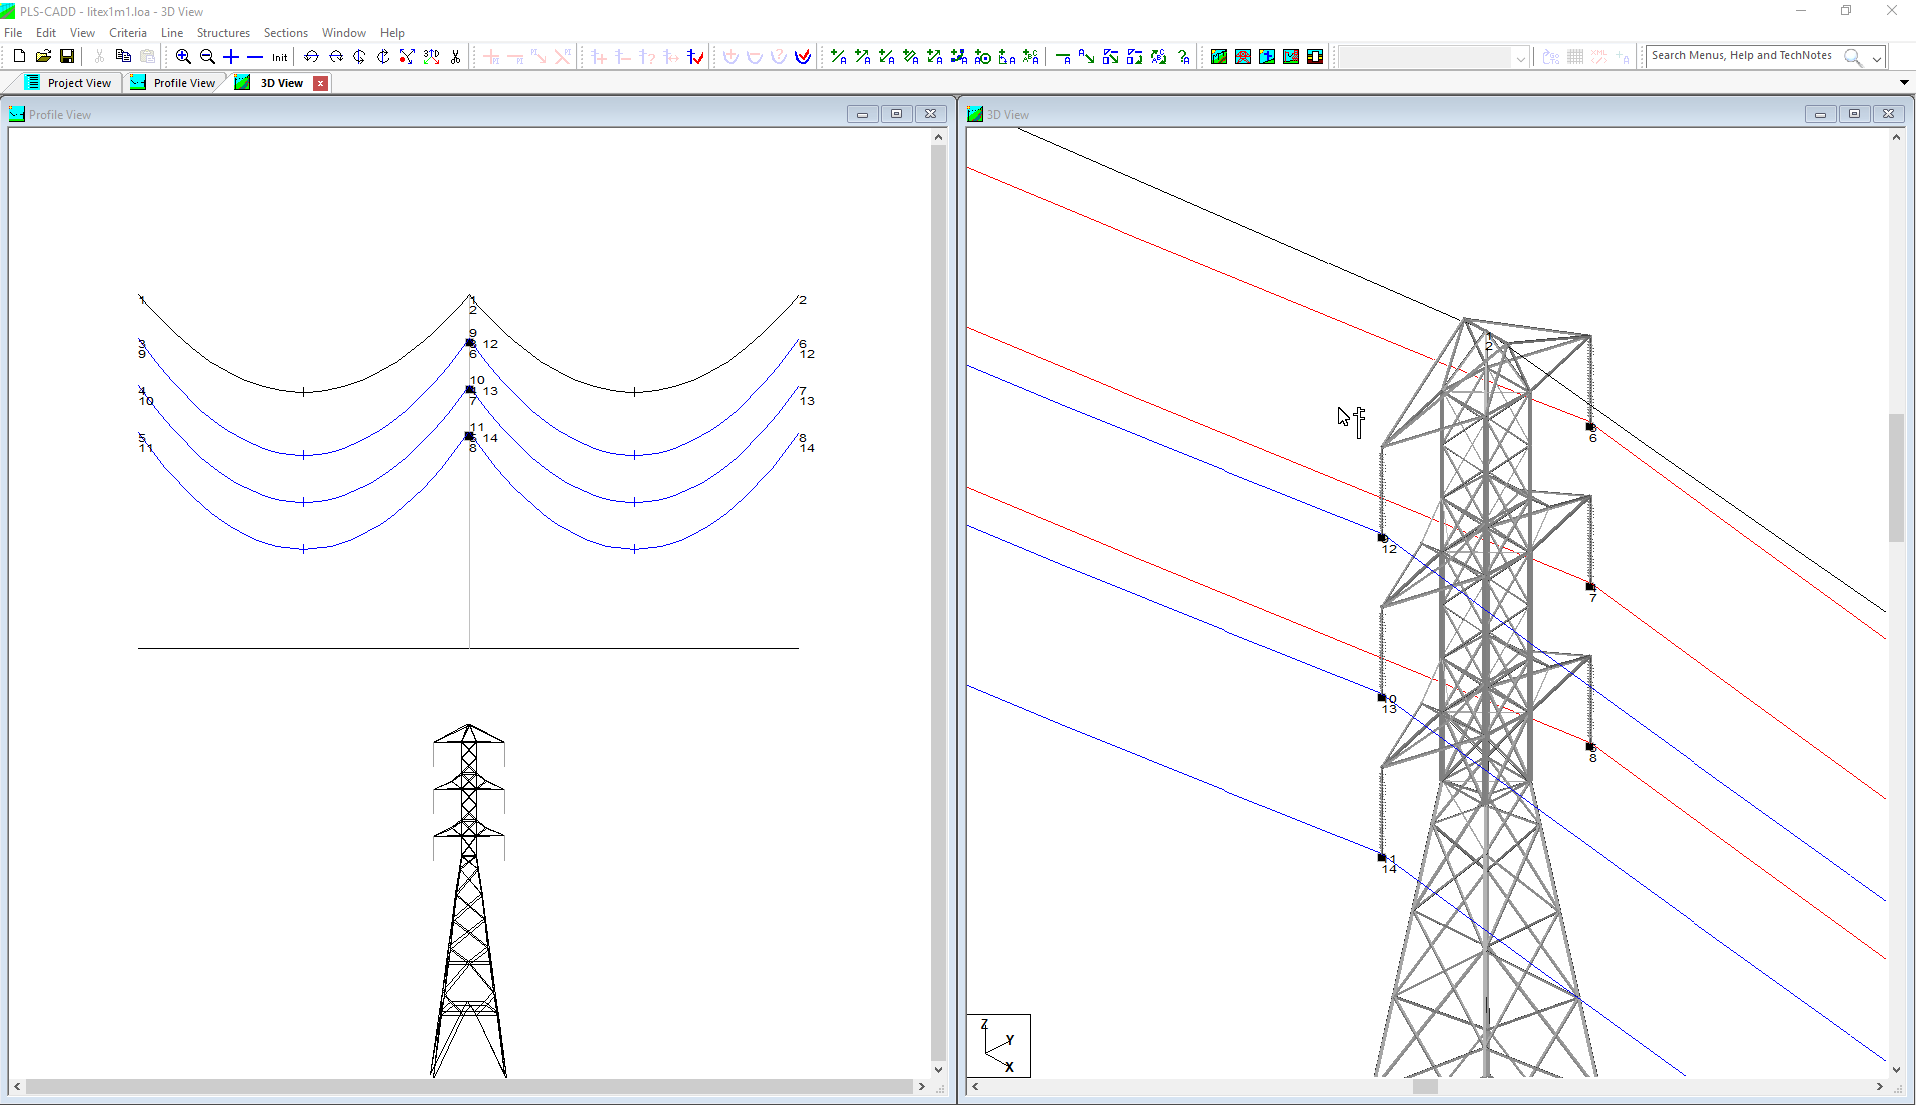
We can ‘edit’ the structure, ‘Structures – Edit Structure’, we will see this.
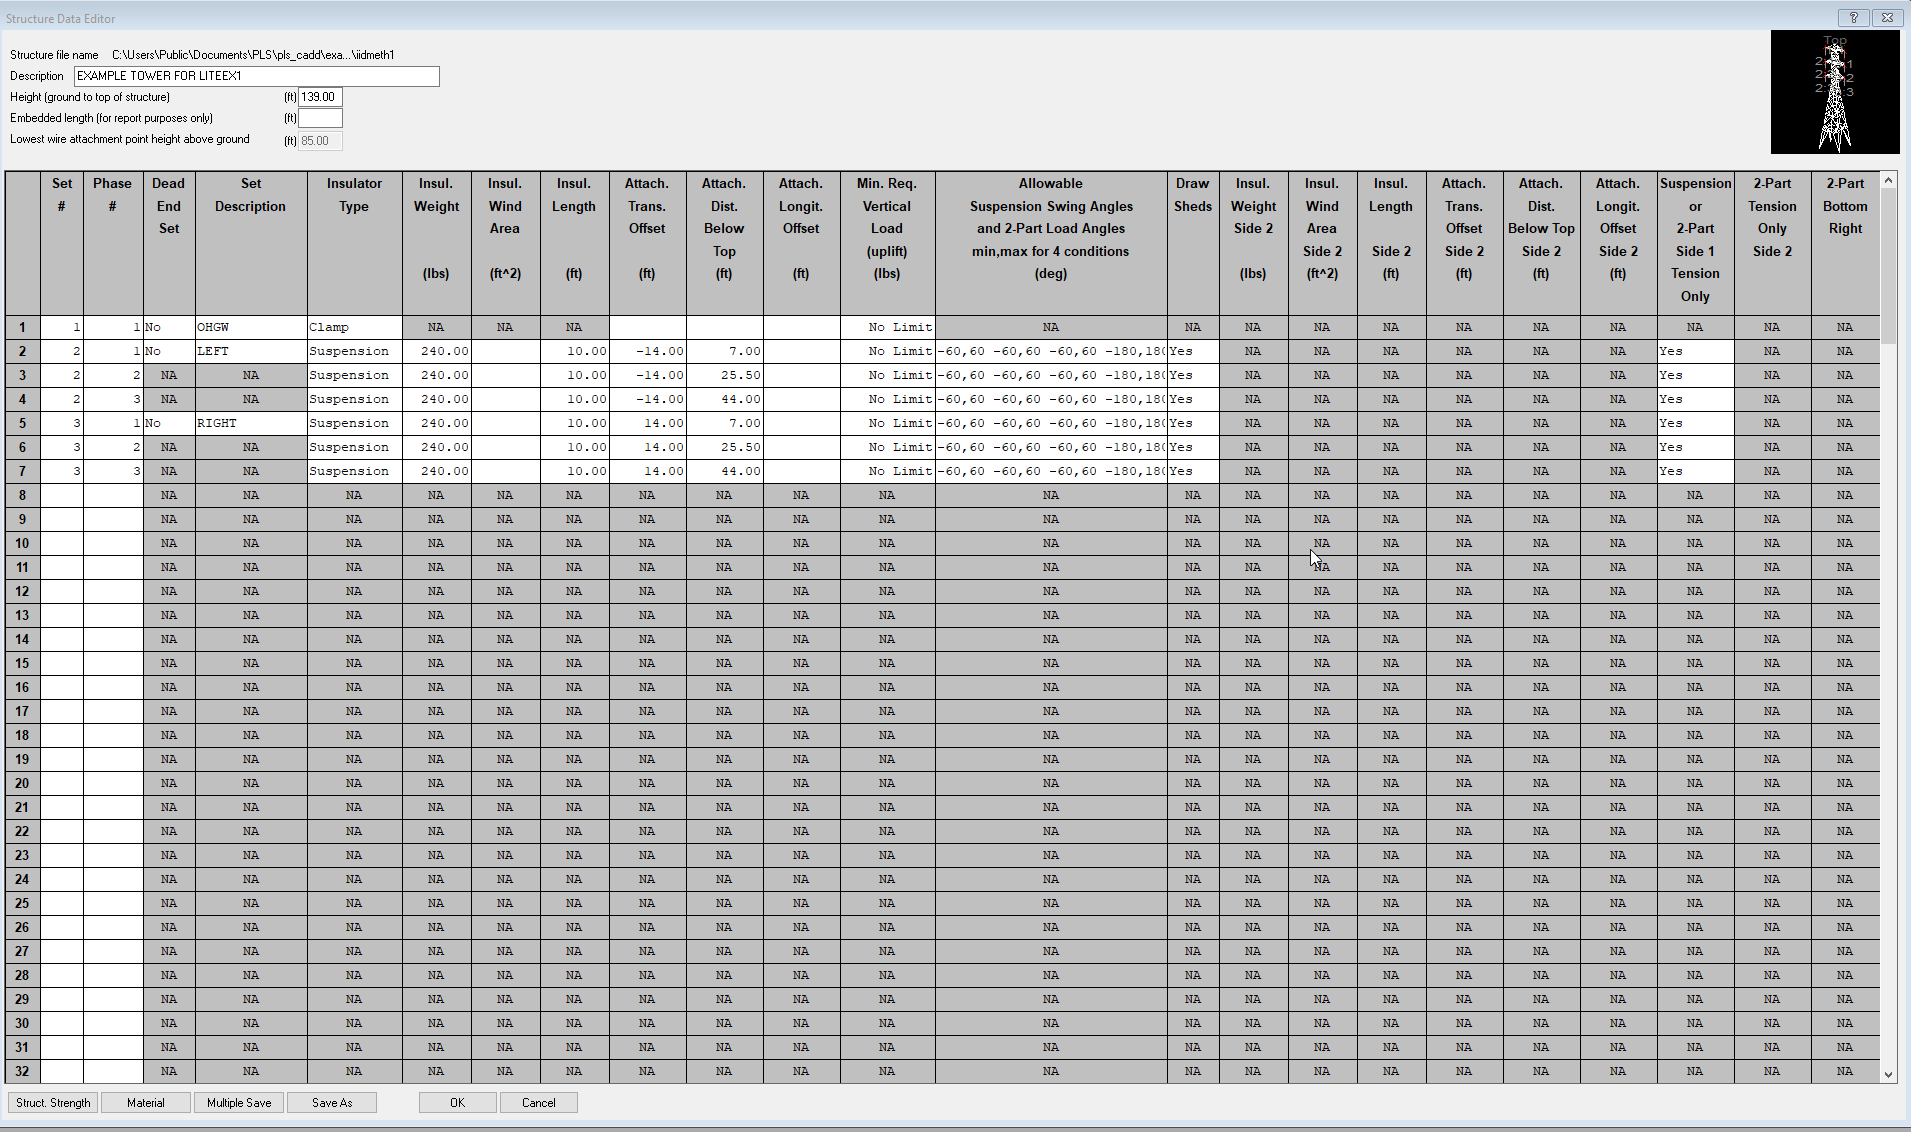
Right down in the bottom left we can see a button for ‘Structure Strength’. When selected you will see the following.
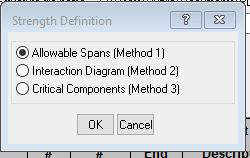
Hit OK and you will see the following;
What are the advantages and disadvantages of the ‘allowable spans’model?
Disadvantages:
The allowable spans apply to one conductor system, if the conductor system changes so does the envelope.
The allowable spans apply to one location or geographic area, if that location changes so will the envelope.
Advantages:
The allowable spans are often readily available and have limits of validity associated with their use; such as conductor system, altitude and geographic range.
2. What do we mean by an interaction diagram model?
Let’s take a look at an ‘interaction diagram model’ and work out what’s going on; using the same file as before ‘Litex1m1.loa’.
The file opens up as above.
Again Edit Structure brings up the Dialog Box and then ‘Structure Strength’ gives the following box. We are now going to select Interaction Diagrams.
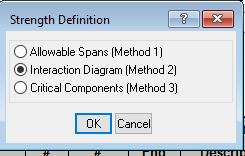
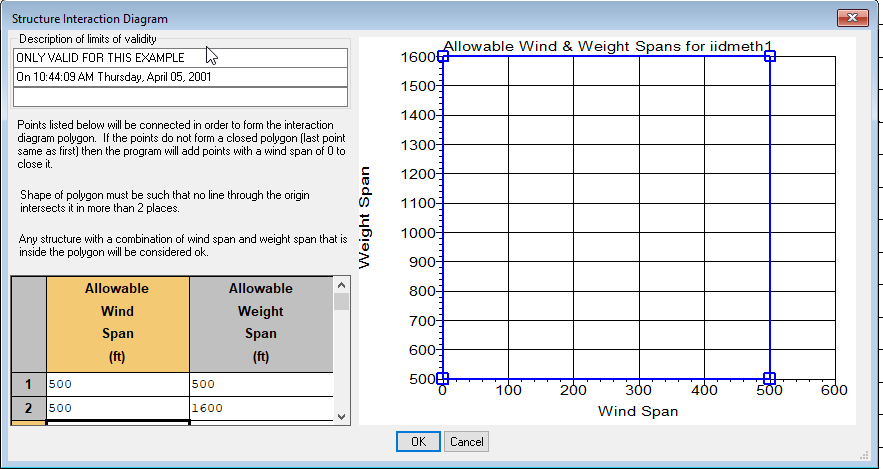
Selecting OK, shows the following.
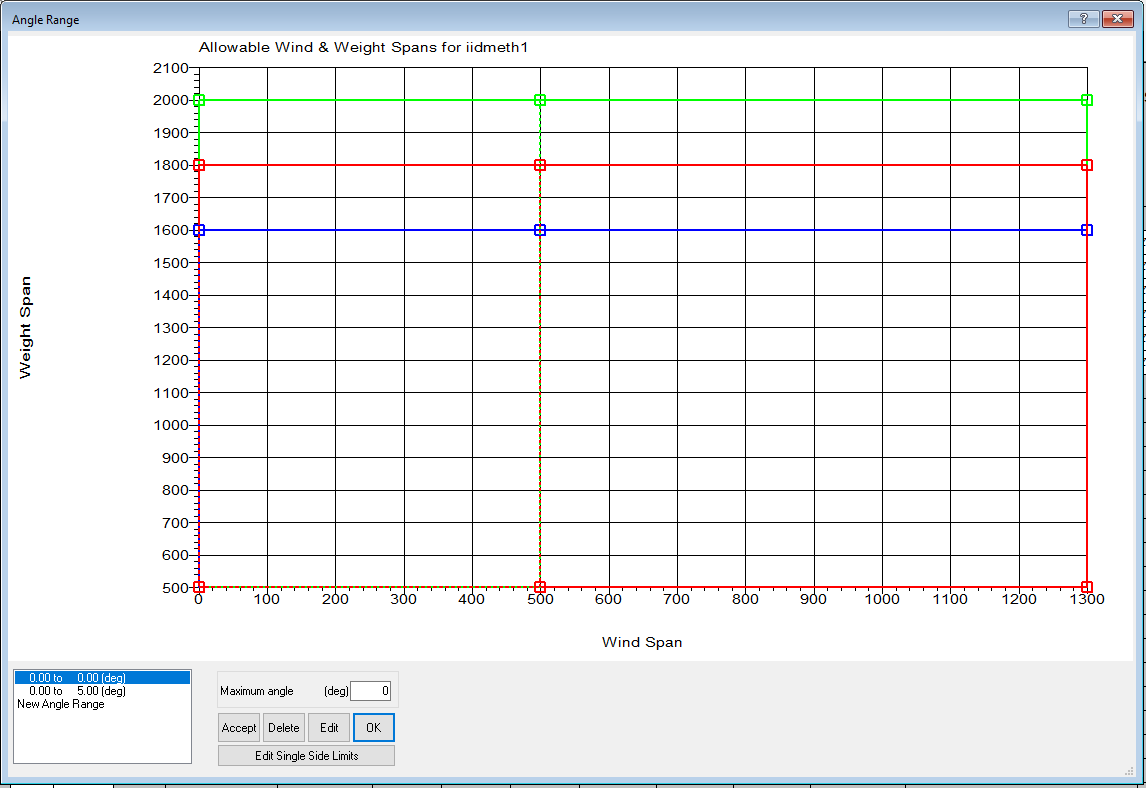
This needs a little bit of interpretation. The colored vertical lines show the maximum wind span for each angle range; the dotted lines show the maximum wind span (500 feet) for 0-5 deg, the full lines show the maximum wind span (1300 feet) for 0 deg deviation. As we would expect, increasing the Angle of Deviation on a structure will reduce the allowable Wind Span. Remember Wind Span is about Horizontal Loads, Weight Span is about Vertical Loads.
We can now see three horizontal lines, blue, red and green. These are not actually ‘horizontal lines’ and actually define a ‘loading envelope’ or polygon for each entered Load Case. As this is a very simple Polygon, it looks like horizontal and vertical lines.
All the Load Cases: blue, red and green; share the same ‘Minimum Weight Span’ of 500 feet. This is a ‘tangent’ structure with ‘suspension’ insulators and as such would be expected to always have a positive value of weight span. Typically somewhere between 50 and 70% of the standard span length (depending on structure and insulator specifics).
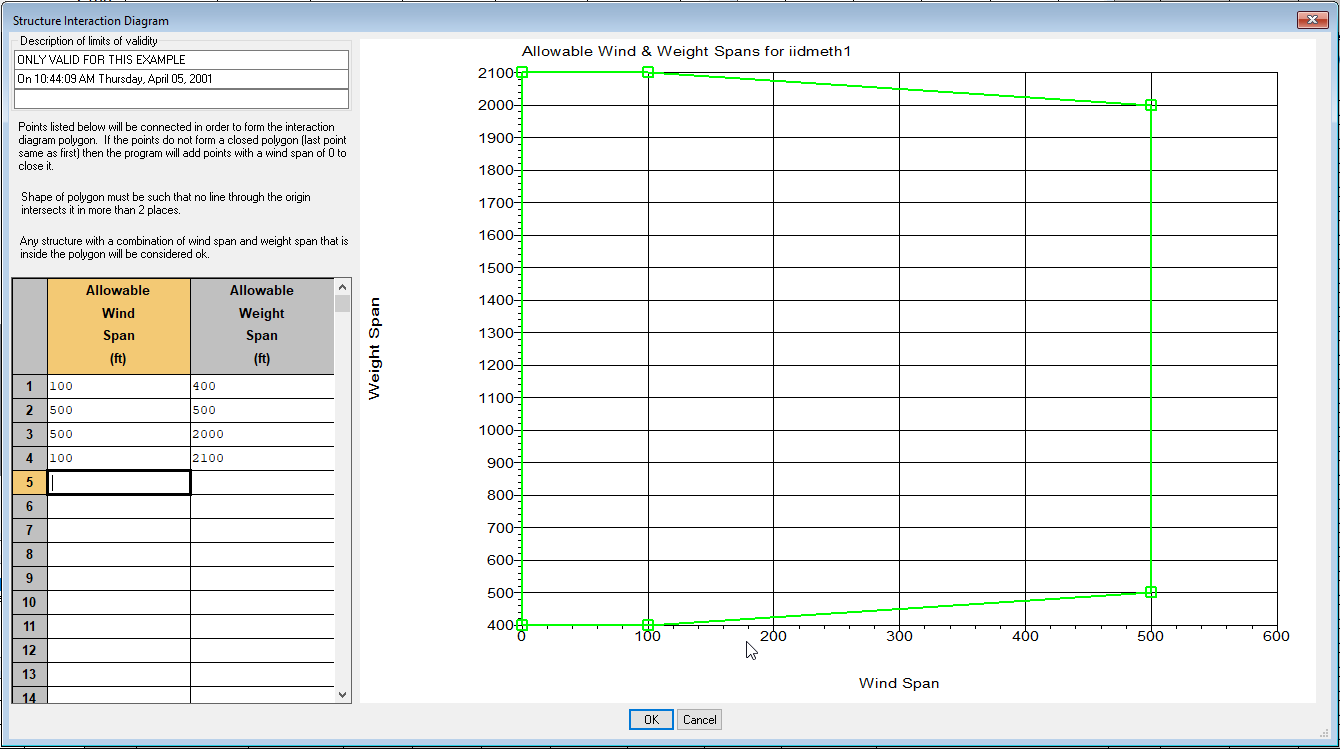
To understand a little more about these blue, red and green polygons; let’s select an angle range. I’m going for 0-5 deg. A double click shows the following.
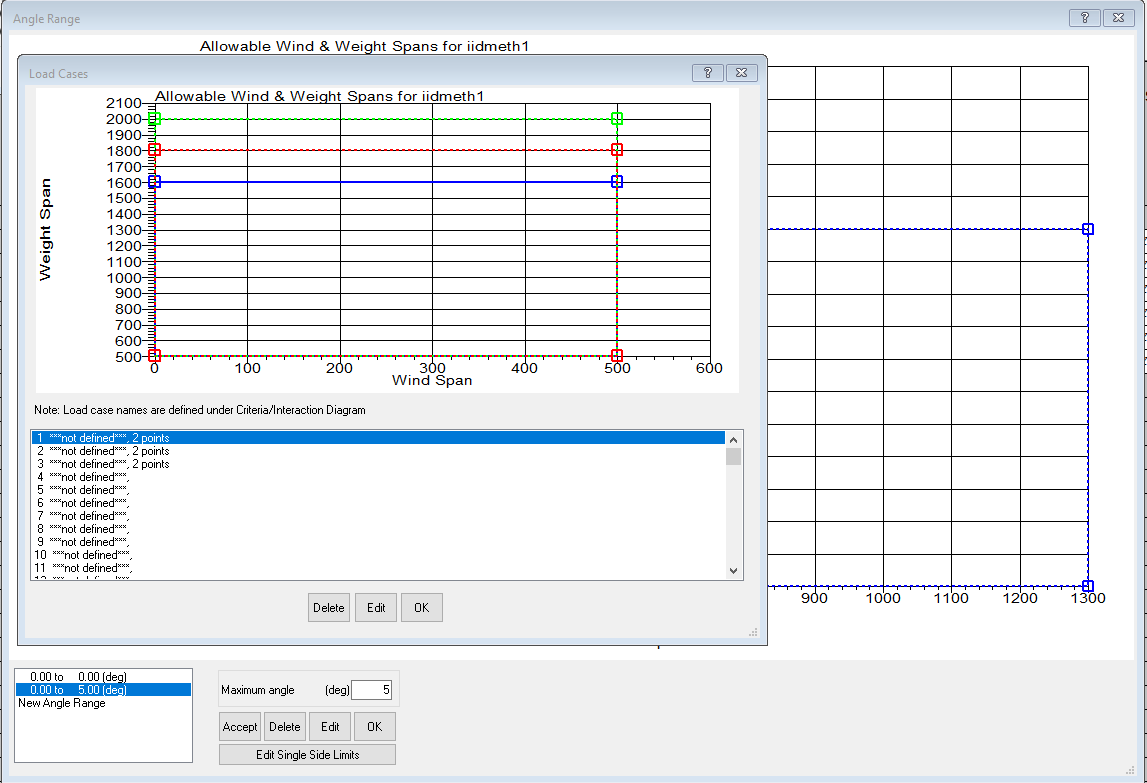
You can see at the lower part of the window there are ‘load case names’ defined. It says ‘not defined’ as each load case must be assigned a ‘weather case’ and ‘conductor condition’ in ‘Criteria – Interaction Diagrams’.
Let’s click on the top Load Case, LC1. The polygon associated with the blue lines is shown.
The polygon shown is rectangular; it does not have to be the case. Often the structure will have additional ‘wind span’ capacity, when it is between the extreme ends of allowable ‘weight span’, so as an example I could add in two further points, to stretch the allowable capacity envelope.
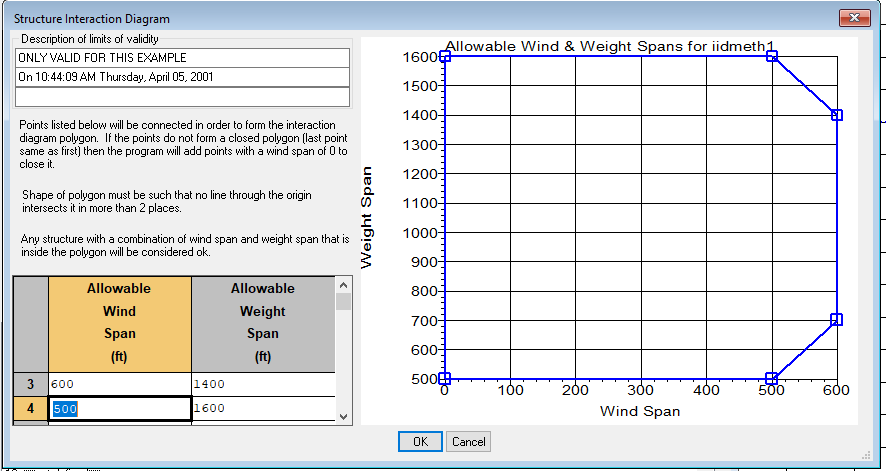
I'm going to cancel that and select LC2, or the Red Capacity Envelope. While before we were able to increase the allowable wind span when the weight spans are in the middle ranges, we can also find additional capacity for weight span, whenever the wind span is low. So a typically envelope for ‘low wind span’ may show a relaxation both for the maximum and the minimum allowable weight span.
What are the advantages and disadvantages of the ‘interaction diagram’ approach?
Disadvantages:
The interaction diagram is conductor system specific, if the conductor system changes, so does the envelope.
The interaction diagram is location specific, if the location changes, so does the envelope.
While the logic behind the interaction diagram behavior is sound and can be estimated, it cannot be computed without a full structural model and analysis.
Advantages:
The interaction diagram can take advantage of the different allowable capacities for different load cases and the interactions therein between allowable wind span and allowable weight span.
In conjunction with a full structure model and analysis the Interaction Diagram can give an excellent representation of true allowable capacity which can then be utilized in performing line optimization studies.
3. What do we mean by a critical components model?
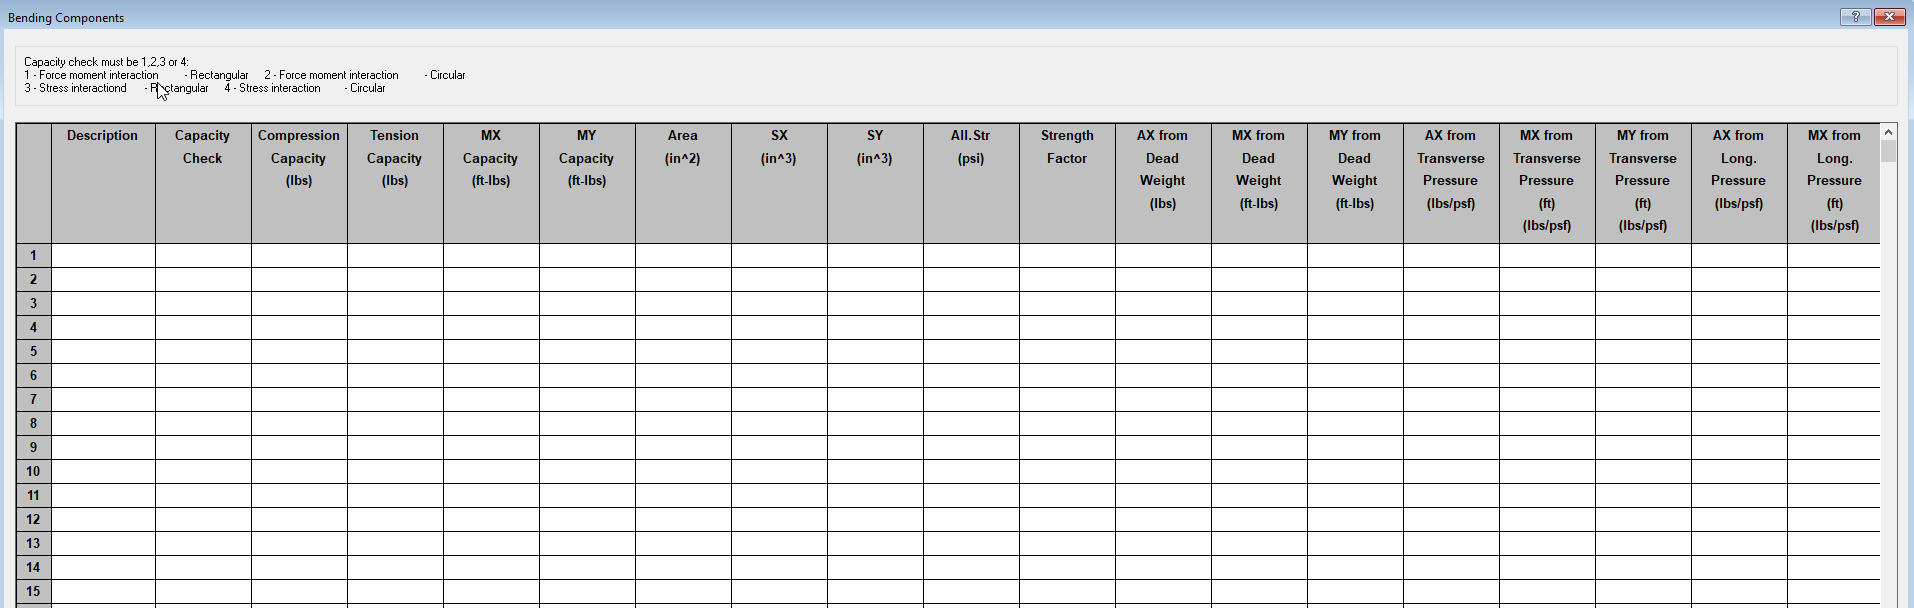
The critical components method allows TLV values (conductor loading) and wind pressures (structure loading) to be identified for each structure. The software will then compare the applied loadings under the relevant loading cases, against the allowable TLV’s with appropriate factors of safety.
Critical components structures were used as substitutes for Full Structural Models, when a full analysis was prohibitive in terms of time and memory requirements. The simplified method used a Matrix of influence co-efficient, relating forces and moments in the Critical Components, to unit loads at the structure attachment points.
Critical Components structures are no longer fully supported by PLS CADD, and the ability to read them only exists to preserve backwards compatibility. The detailed information regarding the usage of Method 3 structures has been withdrawn from the PLS CADD manual and the guidance is given to ‘consult older versions of the PLS CADD manual if you wish to use Method 3 structures.
I feel a little sorry for the Critical Components structures, they were fine in their time but look a little old fashioned now; they get ignored by their family for most of the year, but guilt at their exclusion sees them invited round for (a slightly embarrassing) Christmas lunch.
What are the advantages and disadvantages of the ‘critical components’ approach?
I’m probably swimming against the tide with Powerline Systems here, as I still see a huge number of structures who’s strengths are primarily defined by T,L,V, loadings and can still see a use for this approach. It is more accurate than allowable spans and the information probably more accessible than interaction diagrams. Allowable TLV’s mean that the structure is no longer constrained by a single conductor system or a particular location.
Disadvantages:
As well as the TLV point loads, there are also Axial and bending loads, and allowable stresses that need to be supplied for the ‘Critical Components’. Without a fully documented manual and an active ‘support’ team, this is going to be some job.
A ‘Full Structural Model’ is most accurate and will give the actual strengths of all components, the term ‘Critical Components’ seems a bit of a misnomer, as without a full structural analysis under the relevant conditions how would one know which components are critical?
Critical Components could not effectively model vee strings or two part insulators; could not model non-linear components, or any guyed structures. That shouldn’t really be a big deal, as modeling of poles is so easy (as a Full Structural Model in PLS Pole) in the vast majority of cases, that modeling as anything else is bordering on criminality.
Finally, straight out of the PLS CADD manual; “However, with the availability of efficient programs such as TOWER or PLS-POLE which can now perform an accurate structure analysis and design check in a fraction of a second (or a few seconds for a very large nonlinear tower with thousands of members) the need for Method 3 structures no longer exists. With Method 3 structures you could not: 1) use V-strings or 2-parts insulators competently, 2) model nonlinear structures such as flexible poles for which the P-Delta effect is significant or any guyed structure, 3) easily modify member properties or gain intuition as to the original structure model, 4) obtain structure deflections, and 5) display the structure with components color-coded by percent strength utilization. Therefore, for these reasons and others, Method 3 structures are obsolete.”
4. What do we mean by a full structural model?
If we want to understand the behavior of a structure at a component level, rather than a global definition of strength, we need to define the strength of the individual components; how they are connected and how the load will be transmitted through these components. To do that we have to use a ‘Full Structural Model’.
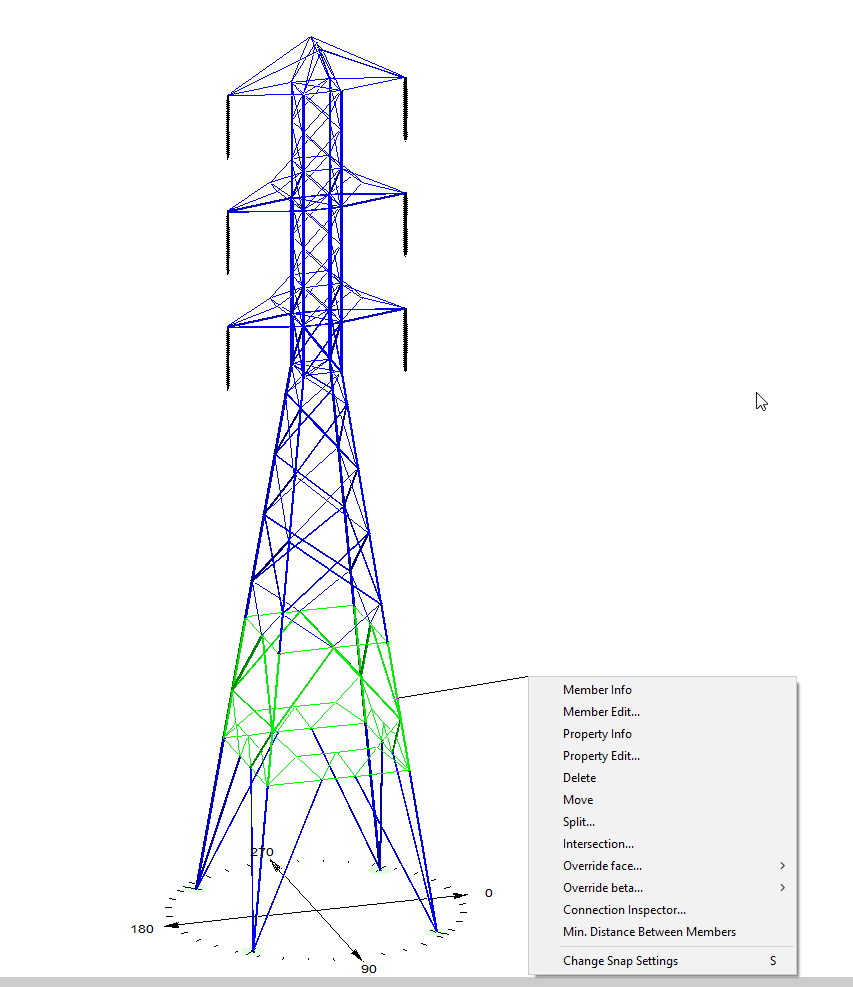
Interrogating the structure by use of ‘left click’ brings up the menu above. Zooming in to the green area we can look at some other options.
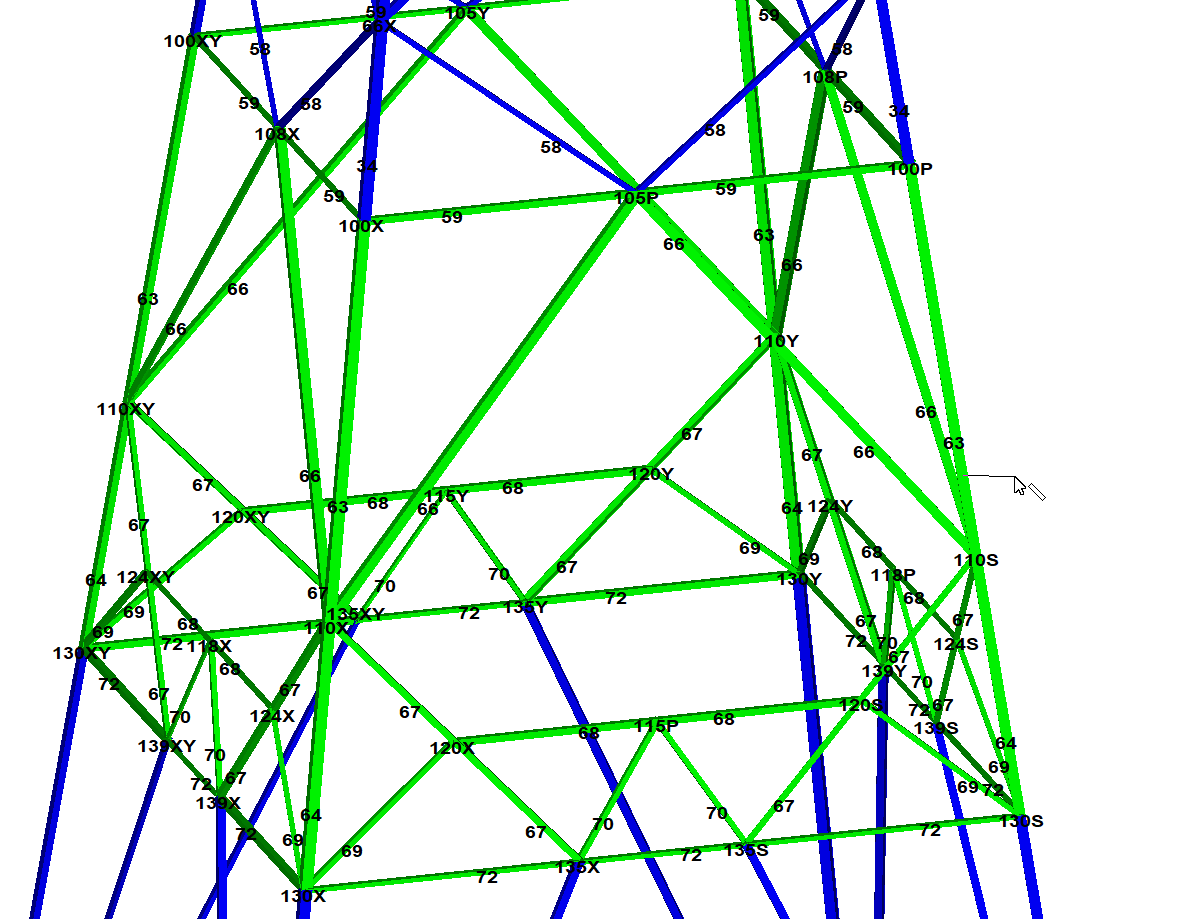
This single diagonal cursor mark denotes ‘member information’. So the geometry is defined by joints, the components by the ‘group’ information and the ‘connections’ by the ‘member’ information. In this way, every component has its allowable capacity (be that bolt shear, buckling, block shear, net section) and that capacity can be compared to the loadings arising from the weather conditions in PLS CADD.
Now I’m going to let you in on a secret if you count them off from top to bottom all of these structure methods correspond to Method1, 2, 3 and 4 respectively. I think it’s probably wisest to give these things their full name, at least until you are absolutely confident in the correct assignment and definition of the ‘shorthand’.
I’ve heard on countless occasions ‘Project Managers’ (as ‘real’ Engineers would never do such a thing) bandy around terms like M2 and M4 structures with absolutely no real appreciation as to what they mean.
Conclusion
PLS CADD allows a number of options to be used to define structure strength. These options are best referred to as ‘allowable spans’, ‘interaction diagrams’ or ‘full structural model’. The selection of which structure method is best for your application will depend on the information you have available. It should be noted that ‘Full structural models’ cannot be used directly for ‘Tower Spotting’ but they can be converted into ‘Allowable Spans’ or ‘Interaction Diagram’ models which can then be used in Tower Spotting.
Just like the structures, the wire behavior; or more accurately the conductor system behavior, varies depending on the approach we adopt. In the same way that for structures we have M1, M2, M3 and M4; for Wires, we have L1, L2, L3 and L4. More on that in our next ‘Ask an Engineer’.
About the Author
As Director of Engineering and heading up research and development at NM Group, Paul Richardson is a renowned power industry expert and long-time proponent of the use of 3D modeling in improving reliability and utilization, while minimizing cost. He is a chartered civil engineer (BEng Hons, CEng, MICE), and retains a wealth of experience, including more than 30 years of power line engineering.